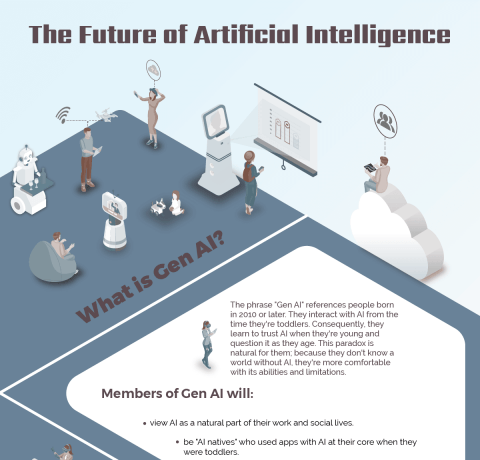
Transform Raw Data Into Visual Stories: The Complete Guide to AI Infographic Generation
The Evolution of Visual Storytelling
I've witnessed a remarkable transformation in how we create visual content. The traditional 9-hour design process that once cost $315 has been revolutionized by AI, now taking just 2 minutes and costing less than $1. This isn't just about saving time and money—it's about democratizing professional design and empowering everyone to become a visual storyteller. In this comprehensive guide, I'll show you how AI infographic generators are reshaping visual communication and how you can leverage these tools to transform your raw data into compelling narratives.
Understanding AI Infographic Generation Technology
When I first explored AI infographic generation, I was amazed by how these tools have evolved beyond simple template filling. Today's AI-powered platforms combine three core capabilities that fundamentally change how we approach visual communication: automated data exploration and analysis, intelligent visualization selection, and narrative building algorithms.
Core Capabilities of Modern AI Infographic Tools
-
●
Data Exploration & Analysis: AI automatically examines datasets, identifying the most important insights worth highlighting
-
●
Intelligent Visualization: Algorithms select optimal chart types and layouts based on your data structure
-
●
Narrative Building: AI connects data points into coherent stories that resonate with audiences
I've identified three distinct approaches in the AI infographic ecosystem. Template-based systems like Canva and Venngage offer AI assistance within pre-designed frameworks. Data-driven generators such as Infogram and Powerdrill Bloom focus on transforming raw datasets into visualizations. Meanwhile, prompt-based creators like Piktochart AI and Text2Infographic generate complete infographics from natural language descriptions.
What sets PageOn.ai apart is its Agentic approach using the Plan, Search, Act methodology. Rather than simply generating visuals, PageOn.ai understands your intent, searches for relevant context, and creates comprehensive visual narratives that truly communicate your message. This approach transforms the fuzzy thoughts in your mind into clear, impactful visual expressions.
AI Infographic Generation Process Flow
Here's how modern AI transforms your input into stunning infographics:
flowchart TD
                        A[User Input] --> B{Input Type}
                        B --> C[Text Prompt]
                        B --> D[Data Upload]
                        B --> E[Topic Description]

                        C --> F[NLP Processing]
                        D --> G[Data Analysis]
                        E --> H[Content Research]

                        F --> I[AI Generation Engine]
                        G --> I
                        H --> I

                        I --> J[Template Selection]
                        I --> K[Chart Generation]
                        I --> L[Layout Optimization]

                        J --> M[Final Infographic]
                        K --> M
                        L --> M

                        M --> N[User Customization]
                        N --> O["Export & Share"]

                        style A fill:#FF8000
                        style M fill:#66BB6A
                        style O fill:#42A5F5
The Market Landscape: Top Players and Their Approaches
After extensively testing over 20 AI infographic tools, I've categorized the market into three distinct segments based on their core strengths and approaches. Understanding these categories will help you choose the right tool for your specific needs.
Data-First Solutions
Powerdrill Bloom: From Spreadsheets to Actionable Insights
Powerdrill Bloom stands out as a next-generation tool that doesn't just visualize data—it tells stories with it. Users can upload Excel, CSV, or PDF files, or simply type in a topic, and Bloom automatically explores, analyzes, and visualizes the information. What impressed me most is its integration with AI chart generators, creating diverse visualizations including pie charts, line graphs, scatter plots, and heatmaps.
Key Strength: Automated storytelling that highlights trends and provides actionable business insights—not just pretty pictures.
Infogram: Real-Time Data Visualization
Infogram excels in creating interactive infographics with real-time data feeds. I found it particularly powerful for dashboards and reports that need constant updates. The platform offers over 35 chart types and 800+ map varieties, with direct connections to databases like MySQL and PostgreSQL.
Key Strength: Interactive elements including clickable components, embedded videos, and live data integration.
Design-Centric Platforms
Canva and Adobe Express: AI-Assisted Design
These platforms approach infographic creation from a design-first perspective. Canva's GPT integration allows for conversational design creation, while Adobe Express leverages the Adobe AI image generator ecosystem for sophisticated visual elements. Both platforms excel at maintaining brand consistency across designs.
Key Strength: Extensive template libraries with AI-powered customization suggestions.
Pure AI Generation Tools
Text2Infographic and Infografix: Prompt-to-Visual Magic
These tools represent the cutting edge of AI graphic generators. Simply enter a text prompt like "leading quarterbacks from 2011 to 2020," and within 2 minutes, you have a complete infographic. No design skills, no complex interfaces—just pure AI generation.
Key Strength: Speed and simplicity—perfect for rapid content creation.
Tool Comparison: Time vs. Features
Comparing creation time against feature richness across different tool categories:
Creating Effective Infographics with AI: A Strategic Framework
Through my experience creating hundreds of AI-generated infographics, I've developed a strategic framework that consistently produces compelling visual content. Let me share the key components that will transform your approach to visual storytelling.
Choosing the Right Infographic Type
📊 Statistical Infographics
Best for survey results, KPIs, and data-heavy presentations
📅 Timeline Formats
Perfect for company history, product evolution, or project milestones
🔄 Process Maps
Ideal for workflows, step-by-step guides, and system explanations
⚖️ Comparison Charts
Excellent for decision-making support and feature comparisons
What I particularly appreciate about PageOn.ai's AI Blocks is their ability to adapt to different formats automatically. The system intelligently determines which visualization type best suits your content, saving you from decision paralysis.
Crafting Powerful AI Prompts
Essential Prompt Components
- 1. Clear Objective: "Create an infographic showing..."
- 2. Key Data Points: "Include statistics on X, Y, and Z"
- 3. Style Specifications: "Use a professional, minimalist design"
- 4. Target Audience: "For marketing professionals in tech industry"
Example Prompts That Work
- ✓ "Timeline infographic with key AI milestones from 2010-2024, bright colors, clean layout"
- ✓ "Infographic showcasing top 5 content marketing strategies, with percentages and icons"
- ✓ "Developer marketing infographic with strategies, statistics, circular graphs, blue color scheme"
The AI-Human Collaboration Workflow
I've found that the most effective approach combines AI's computational power with human creativity. Here's my proven workflow:
flowchart LR
                    A[Initial Generation] --> B[AI Heavy Lifting]
                    B --> C[Customization Phase]
                    C --> D[Brand Elements]
                    D --> E[Visual Enhancement]
                    E --> F[Platform Optimization]
                    F --> G[Final Output]

                    style A fill:#FF8000
                    style C fill:#42A5F5
                    style E fill:#66BB6A
                    style G fill:#9C27B0
The integration of AI graphic image generation during the enhancement phase allows for unique visuals that perfectly match your content. PageOn.ai's Vibe Creation feature makes this process conversational—you simply describe what you want, and the system iteratively refines the design based on your feedback.
Advanced Features Transforming Infographic Creation
The latest generation of AI infographic tools offers features that would have seemed like science fiction just a few years ago. I'm particularly excited about how these capabilities are making professional design accessible to everyone.
Intelligent Automation
🎨 Auto-Layout & Alignment
AI automatically arranges elements for optimal visual hierarchy and balance
🎯 Smart Color Selection
Algorithms choose complementary palettes based on content and brand guidelines
📝 Typography Optimization
Automatic font pairing and size hierarchy for maximum readability
🔍 Deep Search Integration
PageOn.ai's Deep Search automatically finds and integrates relevant assets
Interactive and Dynamic Elements
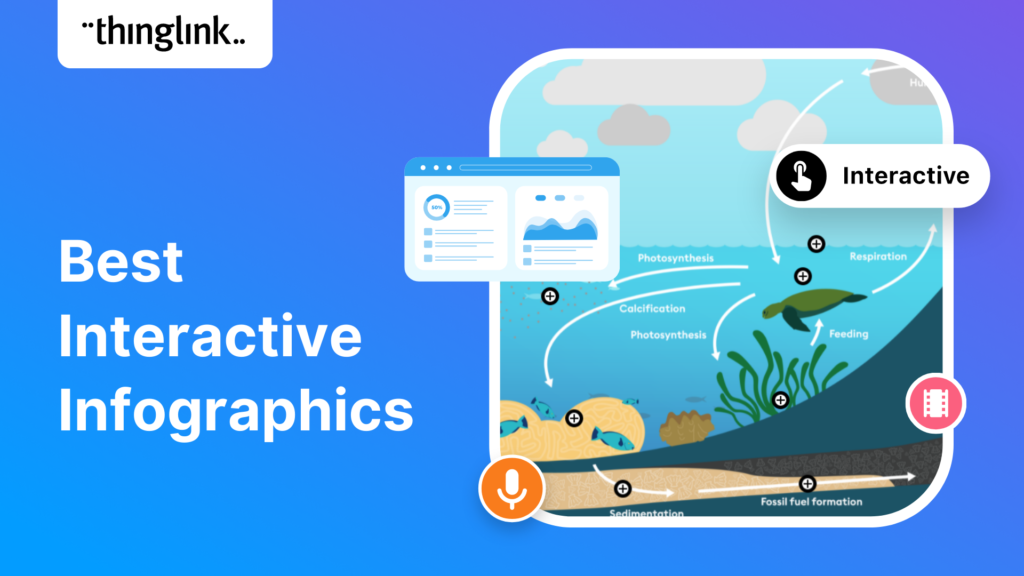
Modern infographics aren't just static images anymore. I've been amazed by the interactive capabilities that engage viewers and encourage exploration:
- ▸ Clickable Components: Transform static elements into interactive exploration points
- ▸ Embedded Multimedia: Integrate videos and animations directly into infographics
- ▸ Real-Time Updates: Connect to live data sources for always-current information
- ▸ Hover Effects: Reveal additional information through mouse interactions
PageOn.ai takes this further by transforming static concepts into engaging visual narratives. The platform's ability to understand context and create multi-layered visual stories sets it apart from simple template-based solutions.
Advanced Features Comparison Across Platforms
Comparing key advanced features across different AI infographic platforms:
Practical Applications Across Industries
Throughout my work with various organizations, I've seen how AI infographic generators transform communication across different sectors. Let me share specific use cases that demonstrate the versatility of these tools.
Business and Marketing
In the business world, I've helped companies create compelling sales presentations and pitch decks that convert. Marketing teams particularly benefit from rapid campaign visual creation—what used to take days now happens in minutes. Internal communication has also been revolutionized; complex performance dashboards and reports become digestible visual stories.
Use Cases:
- • Quarterly performance reports
- • Product launch materials
- • Investor pitch decks
- • Marketing campaign analytics
PageOn.ai Advantage:
Handles complex business narratives with AI Blocks that adapt to different stakeholder perspectives
Education and Research
Educators and researchers face unique challenges in making complex information accessible. I've worked with universities using AI tools to create academic posters that win conferences and classroom materials that engage students. Scientific data visualization has been particularly transformed—researchers can now present findings in ways that reach beyond academic circles.
Success Story:
A research team I collaborated with used PageOn.ai to transform their 50-page climate study into a series of infographics that reached over 1 million people on social media, dramatically increasing their research impact.
Content Creation and Social Media
Content creators have embraced AI infographic tools with enthusiasm. I've seen bloggers triple their engagement rates by enhancing posts with custom infographics. Social media managers create platform-specific visuals that stop the scroll, while newsletter publishers use infographics to boost open rates and click-throughs.
The rapid iteration possible with PageOn.ai's AI Blocks means creators can test multiple visual approaches quickly, finding what resonates with their audience without extensive design investment.
AI Infographic Adoption by Industry
Percentage of professionals using AI infographic tools regularly:
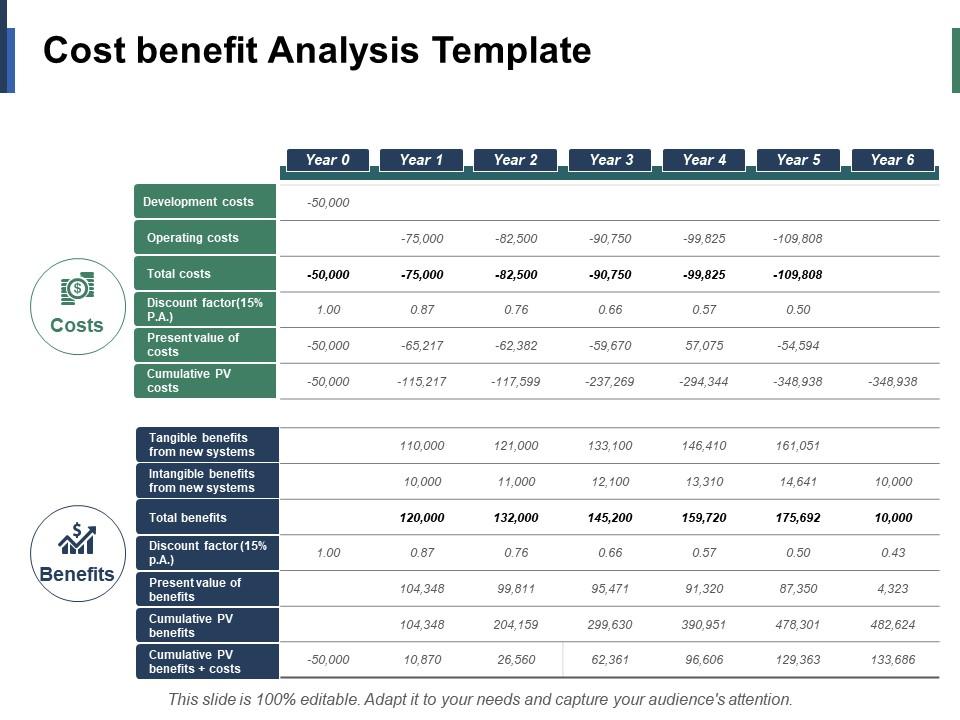
Cost-Benefit Analysis: ROI of AI Infographic Tools
Let me share the financial reality that convinced me to fully embrace AI infographic generation. The numbers are compelling and impossible to ignore.
Traditional Design Costs
Time Investment (9 hours)
- • Research & Planning: 2 hours
- • Conceptualization: 1.5 hours
- • Design Creation: 4 hours
- • Review & Revisions: 1 hour
- • Final Adjustments: 0.5 hours
Financial Cost
$315
Based on $35/hour designer rate
Not including revision cycles or project management overhead
AI-Powered Creation
Time Investment (2 minutes)
- • Enter prompt: 30 seconds
- • AI generation: 60 seconds
- • Quick customization: 30 seconds
Financial Cost
$1
Or less with subscription plans
99% cost savings!
Hidden Costs Saved
Beyond the obvious time and money savings, I've identified several hidden costs that AI eliminates:
Learning Curve Elimination
No need to master complex design software or stay updated with design trends
Revision Cycles Reduction
Instant regeneration means fewer back-and-forth iterations
Team Coordination Time
Eliminate meetings and approval processes with rapid prototyping
Opportunity Cost
Create more content in less time, capturing more market opportunities
PageOn.ai's value proposition extends beyond cost savings. The platform's "Quality without Complexity" approach means you're not sacrificing professional results for speed. The AI understands context and creates visuals that communicate effectively, not just look pretty.
Future Trends and Emerging Capabilities
As someone deeply immersed in this space, I'm excited about where AI infographic generation is heading. The convergence of multiple AI technologies is creating possibilities we're only beginning to explore.
Integration with Office Suites
Microsoft Copilot in PowerPoint already hints at the future—AI that creates complete presentations including infographics. I predict that within 18 months, tools like Notion and Airtable will offer native infographic generation from their databases. Google Slides and PowerBI are likely to implement AI that automatically transforms data into visual stories.
This integration will make AI infographic creation as common as spell-check, fundamentally changing how we communicate in business settings.
Advanced AI Capabilities on the Horizon
🎙️ Voice-to-Infographic
Describe your vision verbally and watch it materialize instantly
🥽 AR/VR Experiences
Immersive infographics that users can walk through and interact with
🧠 Contextual Intelligence
AI that understands your brand, audience, and goals without explicit instructions
🔄 Real-Time Adaptation
Infographics that automatically update and redesign based on viewer engagement
The evolution of AI image generator technology will enable hyper-realistic custom imagery that perfectly matches your content needs. We're moving toward a future where the line between human-designed and AI-generated content becomes indistinguishable.
PageOn.ai's Vision: "Fuzzy Thought to Clear Visuals"
PageOn.ai is advancing toward a future where visual creation becomes as natural as thinking. Their roadmap includes:
- • Thought-Stream Interface: Convert stream-of-consciousness ideas into structured visuals
- • Multi-Modal Input: Combine text, voice, sketches, and data seamlessly
- • Adaptive Learning: AI that learns your style and preferences over time
- • Collaborative AI: Multiple users and AI working together in real-time
timeline
                    title AI Infographic Evolution Timeline

                    2024 : Template-Based AI
                         : Basic Prompt Generation
                         : Simple Customization

                    2025 : Voice Integration
                         : Advanced Context Understanding
                         : Real-Time Collaboration

                    2026 : AR/VR Infographics
                         : Thought-Stream Interface
                         : Predictive Design

                    2027 : Full Autonomy
                         : Multi-Dimensional Visuals
                         : Cognitive Computing
Selecting the Right Tool: Decision Framework
After extensive testing and real-world application, I've developed a decision framework to help you choose the perfect AI infographic tool for your specific needs. Let me guide you through the selection process.
For Data Analysts
Recommended Tools: Powerdrill Bloom, Infogram
If you work with complex datasets and need to extract actionable insights, these platforms excel at automated analysis and storytelling. Powerdrill Bloom particularly shines with its ability to generate not just visualizations but also business recommendations.
Key Features to Look For: Live data connections, statistical chart variety, automated insights generation, export to business intelligence formats
For Marketers
Recommended Tools: Canva, Venngage, PageOn.ai
Marketing professionals need speed, brand consistency, and visual appeal. These tools offer extensive template libraries and brand kit features. PageOn.ai stands out for its ability to understand marketing narratives and create comprehensive visual campaigns.
Key Features to Look For: Brand kit management, social media templates, A/B testing capabilities, multi-format export
For Educators
Recommended Tools: Piktochart, Mind the Graph
Educational content requires clarity and engagement. These platforms offer education-specific templates and scientific illustration libraries. Mind the Graph is particularly valuable for STEM educators with its specialized scientific visuals.
Key Features to Look For: Educational templates, scientific illustrations, accessibility features, student collaboration options
For Rapid Creation
Recommended Tools: Text2Infographic, Infografix
When speed is paramount and you need something "good enough" quickly, these pure AI generators deliver. Perfect for social media content, quick presentations, or initial concept visualization.
Key Features to Look For: Prompt-based generation, minimal customization needed, instant export, mobile accessibility
For Comprehensive Visual Storytelling
Recommended Tool: PageOn.ai
When you need more than just an infographic—when you need a complete visual narrative that adapts to your audience and evolves with your message—PageOn.ai's integrated approach delivers. Its conversational interface and AI Blocks system make complex storytelling accessible.
Key Features to Look For: Conversational design interface, adaptive AI blocks, deep search integration, multi-format storytelling
| Use Case | Best Tool | Price Range | Time to Create |
|---|---|---|---|
| Data Visualization | Infogram | $19-67/mo | 5-10 min |
| Marketing Graphics | Canva | Free-$12.95/mo | 3-5 min |
| Quick Social Posts | Text2Infographic | $70 lifetime | 2 min |
| Complex Narratives | PageOn.ai | Varies | 3-5 min |

Best Practices and Pro Tips
Through countless hours of experimentation and real-world application, I've discovered strategies that consistently produce exceptional results. Let me share the techniques that separate good infographics from great ones.
🎯 Start with Clear Objectives, Not Just Data
Before entering any prompt or uploading data, I always ask myself: "What action do I want viewers to take after seeing this?" This clarity transforms your infographic from a pretty picture into a persuasive tool. Whether it's understanding a concept, making a decision, or sharing insights, your objective should drive every design choice.
Pro Tip: Write your objective as a single sentence and use it as part of your AI prompt for more focused results.
💡 Leverage AI for Ideation, Not Just Execution
I've found that AI excels at suggesting angles you might not have considered. Generate multiple versions with different prompts to explore various storytelling approaches. Sometimes the third or fourth iteration reveals the perfect narrative structure you didn't know you were looking for.
🎨 Maintain Brand Consistency Across AI-Generated Content
Even with AI generation, brand consistency is crucial. I always create a "brand prompt template" that includes color codes, font preferences, and tone guidelines. This ensures every infographic feels like part of a cohesive visual system, regardless of which tool or AI model creates it.
Advanced Techniques I Use Daily
Combine Multiple AI Tools
Use Text2Infographic for rapid ideation, then recreate in Canva for refinement. This hybrid approach maximizes both speed and quality.
Iterative Refinement with PageOn.ai
PageOn.ai's conversational interface allows for natural iteration. Start broad, then progressively refine with follow-up prompts.
Test Visualization Types
The same data can tell different stories. Try timeline, process, and comparison formats to find the most impactful presentation.
Verify AI-Generated Statistics
Always fact-check numbers and claims. AI can hallucinate data, so cross-reference important statistics with reliable sources.
⚠️ Common Pitfalls to Avoid
- • Information Overload: Just because AI can include everything doesn't mean it should
- • Ignoring Context: Always consider where and how your infographic will be viewed
- • Over-Automation: AI is a tool, not a replacement for human judgment
- • Neglecting Accessibility: Ensure color contrast and text readability for all viewers
🚀 My Personal Workflow for Maximum Impact
- 1. Brain Dump: Write everything I know about the topic in plain text
- 2. Objective Setting: Define the single most important takeaway
- 3. AI Generation: Create 3-5 versions using different tools/prompts
- 4. Synthesis: Combine the best elements from each version
- 5. Human Touch: Add personal insights and brand elements
- 6. Testing: Share with a small group for feedback
- 7. Optimization: Refine based on engagement metrics
The Democratization of Visual Communication
We're witnessing a fundamental shift in how humanity communicates. AI has removed the barriers that once separated those with design skills from those without. The question is no longer "how to design" but "what to communicate." This transformation empowers every individual to become a visual storyteller, regardless of their technical background.
Throughout this guide, I've shown you how AI infographic generators are revolutionizing visual communication—from the $315 traditional process to the $1 AI-powered alternative. But this isn't just about cost savings. It's about unleashing human creativity by removing technical constraints.
PageOn.ai exemplifies this mission with their vision of making visual thinking accessible to everyone. Their approach—transforming fuzzy thoughts into clear visual expressions—represents the future of human-AI collaboration. When we combine human creativity with AI's computational power, we create something greater than either could achieve alone.
The Future Is Already Here
As I write this, thousands of people are creating professional infographics who never thought they could. Students are making their assignments more engaging. Entrepreneurs are pitching ideas more effectively. Researchers are reaching wider audiences. This is the democratization of design in action.
The tools I've discussed—from Powerdrill Bloom's data intelligence to Text2Infographic's instant generation—are just the beginning. As AI continues to evolve, we'll see even more powerful capabilities emerge. Voice-controlled design, AR infographics, and thought-stream interfaces aren't science fiction—they're the next chapter in this revolution.
Ready to Transform Your Data Into Compelling Visual Stories?
The tools are here. The knowledge is yours. The only thing left is to start creating. Whether you choose a data-driven platform, a design-centric tool, or PageOn.ai's comprehensive approach, you're now equipped to communicate visually in ways that were impossible just years ago.
Start transforming your ideas into visual stories today. The future of communication is visual, and it's waiting for your unique perspective.
Transform Your Visual Expressions with PageOn.ai
Join thousands who are already creating stunning visual narratives with AI. Experience the power of turning your fuzzy thoughts into crystal-clear visual expressions that captivate and communicate.
Start Creating with PageOn.ai TodayYou Might Also Like
Tracking Presentation Engagement: Transform Your Impact With Built-in Analytics
Discover how built-in analytics transforms presentation engagement. Learn to track audience behavior, implement data-driven strategies, and maximize your presentation impact.
Mastering MCP Architecture: The Ultimate Blueprint for Seamless AI-Data Integration
Explore the Model Context Protocol architecture that solves the N×M integration problem. Learn how MCP creates standardized connections between AI systems and data sources.
Optimizing Websites for AI Agent Interaction: The Ultimate Guide
Learn how to prepare your website for AI agents and assistants. Discover technical foundations, content optimization strategies, and task completion enhancements for the AI revolution.
Transforming Presentations: Strategic Use of Color and Imagery for Maximum Visual Impact
Discover how to leverage colors and images in your slides to create visually stunning presentations that engage audiences and enhance information retention.