Transform Data Into Dynamic Stories: The Complete Guide to Creating Animated Infographics
Unlock the Power of Motion in Data Visualization
In my journey through the evolving landscape of digital communication, I've discovered that animated infographics aren't just trendy—they're transformative. With 90% more views than static content and 82% better information retention, motion-enhanced data visualization has become the secret weapon for capturing attention in our information-saturated world.
Understanding the Power of Motion in Data Visualization
When I first encountered animated infographics, I was skeptical. Could adding motion really make that much difference? The answer, backed by compelling research, is a resounding yes. Studies show that our brains process visual information 60,000 times faster than text, and when you add purposeful animation, information retention jumps by an astounding 82%.
What truly sets animated infographics apart from their static counterparts isn't just movement—it's the ability to control the narrative flow. I've seen how industries from SaaS to healthcare are leveraging these dynamic visualizations to explain complex processes, showcase data trends, and create memorable brand experiences. With tools like PageOn.ai's AI Blocks, we can now assemble animated data visualization tools like LEGO pieces, making sophisticated animations accessible to everyone.
The Evolution from Static to Dynamic
The transformation from traditional infographics to interactive animated formats represents a fundamental shift in how we consume information. I've witnessed the rise of scrollytelling—where content unfolds as users scroll—and click-to-explore experiences that put viewers in control of their learning journey.
According to Mediafly research, interactive content receives 90% more views than static alternatives. This isn't just a marginal improvement; it's a complete paradigm shift. By leveraging PageOn.ai's Vibe Creation feature, I can now adopt a conversational design approach that makes data feel less like statistics and more like stories.
Engagement Metrics: Static vs. Animated Infographics
Core Benefits for Modern Communication
- • Enhanced engagement through visual stimulation: Movement naturally captures and maintains attention, creating a more immersive experience.
- • Simplified complex information delivery: Animation allows for progressive disclosure, preventing information overload.
- • Improved SEO through increased dwell time: Engaging animations keep visitors on your page longer, signaling quality to search engines.
- • 37% higher sharing potential: Dynamic content is more likely to be shared across social platforms.
Essential Components of Effective Animated Infographics
Creating compelling animated infographics requires more than just adding movement to static designs. I've learned that success lies in choosing the right animation types and incorporating multimedia elements strategically. Whether it's motion graphics that guide the eye, parallax scrolling that creates depth, or hover effects that reveal additional information, each technique serves a specific purpose in your visual narrative.

When building these experiences, I rely on PageOn.ai's Deep Search capability to integrate relevant data sources seamlessly. This allows me to create interactive infographics that not only look impressive but also provide genuine value to viewers.
Animation Techniques Workflow
flowchart TD
                        A[User Interaction] --> B{Trigger Type}
                        B --> C[Timed Animation]
                        B --> D[Scroll-Based]
                        B --> E[Click/Hover]
                        C --> F[Progressive Reveal]
                        D --> G[Parallax Effects]
                        E --> H[Hotspot Labels]
                        F --> I[Enhanced Comprehension]
                        G --> I
                        H --> I
                        I --> J[Increased Engagement]
Animation Techniques That Convert
- • Timed animations vs. user-triggered interactions
- • Scroll-based reveals and progressive disclosure
- • Hotspot labels and mouseover effects
- • Smooth transitions using PageOn.ai's Agentic process
Visual Hierarchy and Flow
- • Structure information for maximum comprehension
- • Use color psychology and motion to guide attention
- • Break complex data into digestible sequences
- • Apply the "less is more" principle (60-90 seconds optimal)
Design Strategies for Different Content Types
Throughout my experience creating animated infographics, I've discovered that different content types demand unique approaches. Data-heavy presentations benefit from animated charts and graphs that reveal insights progressively. Process explanations come alive with step-by-step animated workflows. Comparative analyses shine through side-by-side animations, while timeline narratives unfold beautifully with chronological story progression.
Industry-Specific Applications
I've seen remarkable success stories across industries. B2B companies like Bitcoin IRA and SAP use explainer videos to demystify complex products. Educational institutions enhance learning experiences with animated content that makes abstract concepts tangible. Healthcare organizations, following the American Chemical Society's example, transform dense scientific data into accessible visual stories. Marketing campaigns consistently report measurable ROI improvements when incorporating animated infographics.
| Industry | Best Animation Type | Key Benefit | Success Metric |
|---|---|---|---|
| SaaS/Technology | Process Workflows | Simplifies Complex Features | 65% Better Comprehension |
| Healthcare | Data Visualizations | Makes Data Accessible | 78% Engagement Rate |
| Education | Interactive Timelines | Enhanced Learning | 82% Information Retention |
| Finance | Animated Charts | Trend Visualization | 45% Longer Dwell Time |
Platform Optimization
Social Media Formats
Vertical infographics optimized for mobile viewing, with autoplay capabilities and sound-off design principles.
Website Integration
Embedded interactive experiences that enhance user engagement without compromising page load speeds.
Email Marketing
GIF alternatives that maintain visual appeal while keeping file sizes manageable for email delivery.
Presentation Tools
PowerPoint alternatives using PageOn.ai for more dynamic and engaging business presentations.
Technical Implementation and Tools
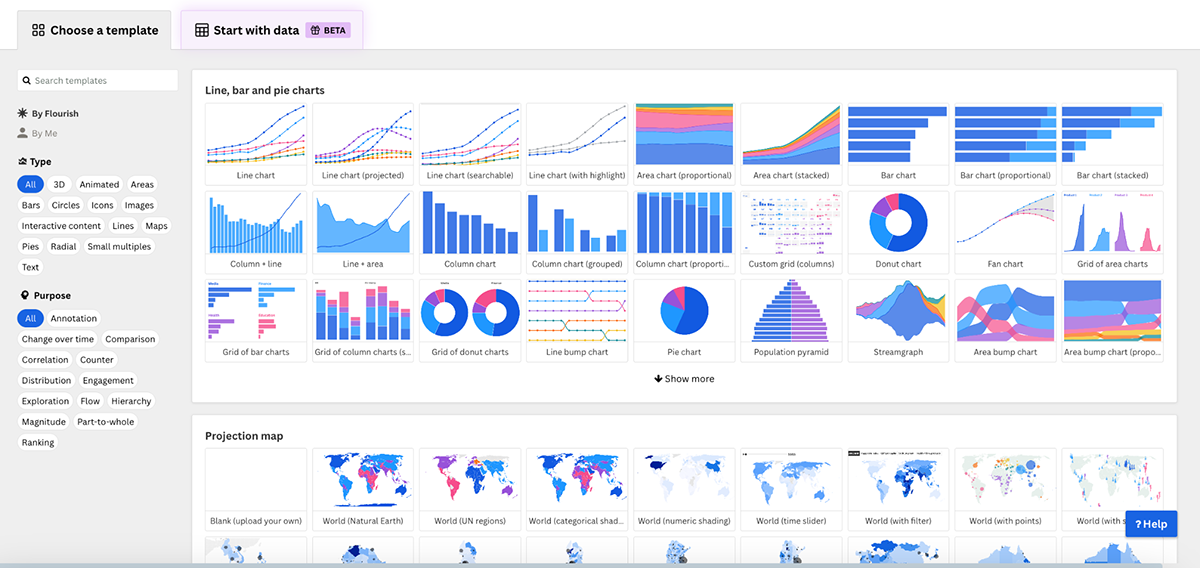
When I first started creating animated infographics, the technical barriers seemed insurmountable. Today, the landscape has transformed dramatically. We now have access to no-code solutions that rival custom development, and platforms like Canva, Animaker, Powtoon, and Adobe Express have democratized animation creation. However, for those seeking to create stunning infographics with AI assistance, PageOn.ai offers a unique advantage through its intelligent design suggestions.
Step-by-Step Creation Process
-
1
Define goals and identify target audience pain points: Use Google Analytics insights to understand what resonates with your viewers.
-
2
Collect and organize data: Leverage research repositories like Statista and Pew Research for credible information.
-
3
Design wireframes and layout structures: Sketch the information flow before adding any animations.
-
4
Implement animations and test functionality: Ensure smooth performance across all devices and browsers.
Platform Capabilities Comparison
Advanced Features and Integrations
- ✓ SCORM and LTI compliance: Seamless integration with learning management systems for educational content.
- ✓ Real-time collaboration: Multiple team members can work on the same project simultaneously.
- ✓ Analytics tracking: Monitor engagement metrics to understand what resonates with your audience.
- ✓ Brand kit implementation: Maintain consistency across all your animated content.
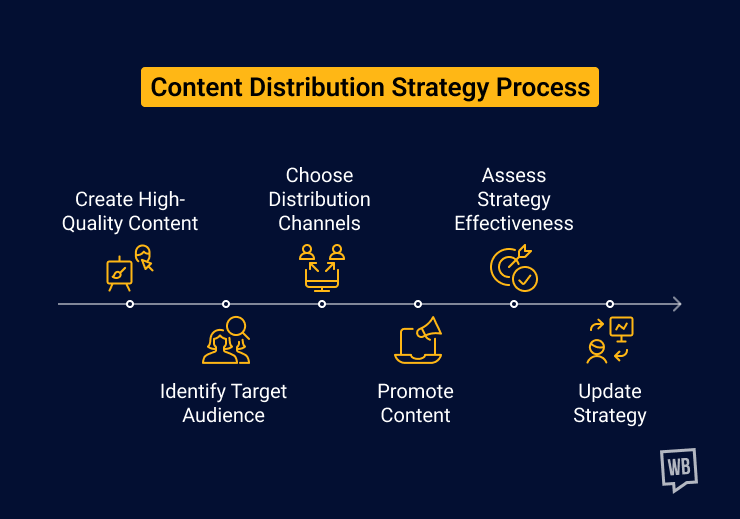
Maximizing Impact Through Strategic Distribution
Creating brilliant animated infographics is only half the battle—I've learned that strategic distribution is what truly maximizes their impact. Multi-channel publishing strategies ensure your content reaches audiences wherever they are, while SEO optimization techniques help your animations get discovered organically. By measuring success through click rates, interaction paths, and time spent, we can continuously refine our approach.
Content Amplification Tactics
I've discovered that creating infographics with viral potential requires understanding platform-specific preferences. Each social network has its own culture and content preferences.
- • Repurpose animations across different platforms
- • Build infographic series for sustained engagement
- • Leverage user-generated content opportunities
Performance Optimization
Technical performance directly impacts user experience. I always prioritize loading speed without sacrificing visual quality.
- • Optimize file sizes for faster loading
- • Ensure mobile responsiveness and touch interactions
- • Implement accessibility features for inclusive design
- • Test cross-browser compatibility thoroughly
Channel Performance Metrics
Future Trends and Innovation
As I look toward the horizon of animated infographic technology, I'm excited by the possibilities emerging. AI-powered animation generation is transforming how we create content, while voice-activated infographic experiences are making data more accessible than ever. The integration of AR and VR technologies promises to take immersion to unprecedented levels, and real-time data visualization updates are making infographics more dynamic and relevant.

Evolution of Infographic Technology
timeline
                        title Technology Evolution Timeline

                        2020 : Static Infographics
                             : Basic Animation Tools

                        2022 : Interactive Elements
                             : No-Code Platforms

                        2024 : AI-Powered Creation
                             : Real-time Data Integration

                        2026 : Voice Activation
                             : AR/VR Integration
                             : Personalized Animations
Emerging Technologies
Machine Learning Integration
Personalized animations that adapt to viewer preferences and behavior patterns in real-time.
Blockchain Visualization
Complex blockchain data transformed into understandable visual narratives.
IoT Data Streams
Live data from connected devices visualized in animated formats.
PageOn.ai Deep Search Evolution
Continuously improving data source integration for richer, more accurate visualizations.
Best Practices for Long-term Success
To stay ahead in this rapidly evolving field, I've developed several strategies:
- → Build reusable animation templates: Create a library of animations that can be quickly customized for different projects.
- → Create modular content blocks: Use PageOn.ai to develop interchangeable components that speed up production.
- → Establish animation style guides: Maintain consistency across all your visual communications.
- → Continuous optimization: Use analytics to refine and improve your animations based on actual user behavior.
Practical Examples and Case Studies
Throughout my journey in creating animated infographics, I've studied countless successful implementations. Each case study offers unique insights into what makes animated data visualization truly effective. From Hulamin Aluminium's environmental storytelling to Moderna's timeline visualization by Goodwin law firm, these examples demonstrate the versatility and power of well-crafted animations.

Hulamin Aluminium: Environmental Storytelling
This case perfectly illustrates how to address "greenwashing" concerns through transparent, data-driven animations. By breaking down complex recycling processes into digestible animated segments, Hulamin built trust while educating their audience.
Result: 65% increase in brand trust metrics
Pinterest: Demographic Data Visualization
Pinterest transformed dry demographic statistics into a compelling visual story about their user base. The animation humanized data, making numbers feel like real people with real interests.
Result: 3x more engagement than traditional reports
Google Big Query: Complex Concept Simplification
Google's approach to explaining Big Query through storytelling demonstrates how narrative structure can make technical concepts accessible. They identified customer pain points and showed transformation possibilities.
Result: 78% comprehension rate among non-technical audiences
Lessons from Top Performers
Webflow's Thought Leadership
Used provocative questions to engage viewers intellectually, comparing coding literacy to traditional literacy.
Sephora's Product Showcase
Implemented clickable hotspots that revealed product benefits and purchase links seamlessly.
Boston Globe's Step-by-Step Guide
Used progressive disclosure to prevent overwhelming readers with digital transformation steps.
FTC's Ransomware Education
Simplified cybersecurity concepts for small business owners in under 90 seconds.
Common Pitfalls to Avoid
- ❌ Information overload: Trying to convey too much in a single animation
- ❌ Gratuitous effects: Adding movement that doesn't serve the narrative
- ❌ Mobile neglect: Failing to optimize for smaller screens
- ❌ Accessibility oversight: Ignoring users with disabilities
Getting Started with PageOn.ai
After years of experimenting with various tools, I've found that PageOn.ai offers the most intuitive path to creating professional animated infographics. The platform's ability to transform fuzzy thoughts into clear animated visuals sets it apart. By leveraging AI Blocks for rapid prototyping and implementing proven infographic design principles, you can scale production with Agentic workflows that maintain quality while increasing efficiency.

Quick Win Strategies
I always recommend starting small and building momentum. Here's my proven approach:
- 1 Start with simple text-heavy animations: Transform existing content into animated formats before creating from scratch.
- 2 Focus on one key message per infographic: Resist the temptation to include everything.
- 3 Test with internal stakeholders first: Get feedback before public release.
- 4 Iterate based on engagement metrics: Let data guide your improvements.
Advanced Implementation
Once you've mastered the basics, it's time to explore advanced techniques that can set your content apart:
Complex Data Storytelling
Layer multiple data sets with coordinated animations that reveal relationships and patterns progressively.
Multi-language Considerations
Design animations that work across languages with different text lengths and reading directions.
Enterprise Deployment
Scale your animated infographic production across teams while maintaining brand consistency.
Marketing Tech Integration
Connect your animations with existing marketing automation and analytics platforms.
Transform Your Visual Expressions with PageOn.ai
Ready to create animated infographics that captivate, educate, and convert? PageOn.ai's AI-powered platform makes it easier than ever to transform complex data into compelling visual stories. Join thousands of creators who are already revolutionizing their content with intelligent design assistance.
Start Creating with PageOn.ai TodayYou Might Also Like
Healing from Workplace Trauma While Planning Your Career Exit | Recovery Strategies
Discover effective strategies for healing from workplace trauma while planning your career exit. Learn to rebuild confidence, create support systems, and chart a path to psychological safety.
Building Consistent Design Systems for Enhanced Learning Experiences: A Visual Framework
Discover how to create cohesive educational design systems that improve learning outcomes through visual consistency, reduced cognitive load, and systematic approaches to educational content delivery.
Smart Icon Libraries: Transform Your Document Design with Visual Intelligence
Discover how smart icon libraries can enhance your document design. Learn strategic icon selection, AI-powered systems, and visual communication techniques for better engagement and retention.
Unlocking Innovation: How Democratized Development Tools Break Technical Barriers
Discover how democratized development tools are reshaping technical landscapes by breaking down barriers, enabling non-technical users to create sophisticated applications without coding expertise.