Visualizing Data Distinctions: Transform Bar Diagrams and Histograms from Confusion to Clarity
Master the Art of Choosing Between Bar Charts and Histograms
I've witnessed countless data presentations derailed by a simple yet critical mistake: using the wrong chart type. Today, I'm sharing my insights on the bar chart vs histogram debate – a distinction that can make or break your data story. Let's transform this common confusion into crystal-clear understanding.
The Visual Confusion Crisis
I can't tell you how many times I've seen brilliant analysts stumble when choosing between bar charts and histograms. This widespread misunderstanding isn't just a minor inconvenience – it's a crisis that undermines the very foundation of data-driven decision making.
When we select the wrong chart type for our analysis, we're not just making a formatting error. We're fundamentally miscommunicating our data's story. I've watched executives make million-dollar decisions based on misinterpreted visualizations, all because someone confused these two chart types.
Why does this clarity matter so much? Because effective data communication is the bridge between raw numbers and actionable insights. When we blur the lines between bar charts vs histograms, we're essentially speaking different languages to our audience while thinking we're saying the same thing.
The good news? With tools like PageOn.ai's visual structuring capabilities, we can eliminate this confusion instantly. By understanding the fundamental differences and leveraging intelligent visualization platforms, we transform ambiguity into clarity with just a few clicks.
Decoding the Fundamental DNA of Each Chart Type
Bar Charts: The Category Comparator
Let me share what I've learned about bar charts through years of creating data visualizations. Bar charts are the workhorses of categorical data representation. Each bar stands alone, separated by intentional gaps that scream "these are different things!" to our visual cortex.
Think of each bar as an independent entity, like different products on a shelf. The gaps between bars aren't just aesthetic choices – they're visual punctuation marks that say "this category ends here, and a new one begins there." This separation is crucial for our brains to process discrete comparisons quickly.
Product Sales Comparison
A classic bar chart showing discrete category comparisons:
When I use PageOn.ai's AI Blocks to build category comparisons, it's like assembling LEGOs – each piece distinct yet part of a larger picture. The platform understands that categorical data needs breathing room between elements.
Histograms: The Distribution Detective
Now, histograms tell a completely different story. I think of them as distribution detectives, revealing patterns in continuous data that would otherwise remain hidden. The bars touch each other because they represent a continuous flow of values – there are no gaps in the number line!
Each bar in a histogram represents a bin or interval of values. The height shows frequency, but here's the critical difference: the area of each bar is mathematically significant. It represents the proportion of data falling within that range.
Age Distribution Analysis
A histogram showing continuous data distribution:
Using PageOn.ai's Deep Search feature, I can automatically integrate relevant statistical visualizations that understand these nuances. The platform recognizes when data needs to flow continuously versus when it needs categorical separation.
The Critical Decision Points: When to Choose What
Data Type as Your North Star
I've learned that the fundamental split between categorical and continuous data should be your primary guide. Let me share some real-world scenarios that have crystallized this for me:
- Categorical data: Product types, customer segments, geographic regions, survey responses
- Continuous data: Temperature readings, income distributions, time measurements, test scores
But here's where it gets tricky – discrete numerical data sits in a gray area. For instance, if I'm analyzing the number of children in families (0, 1, 2, 3, etc.), I could technically use either chart type. My choice depends on whether I want to emphasize the individual counts (bar chart) or the distribution pattern (histogram).
Data Type Decision Flow
Follow this flow to choose the right visualization:
flowchart TD
                        A[Start: What type of data?] --> B{Is it categorical?}
                        B -->|Yes| C[Use Bar Chart]
                        B -->|No| D{Is it continuous?}
                        D -->|Yes| E[Use Histogram]
                        D -->|No: Discrete| F{What's your goal?}
                        F -->|Compare counts| G[Use Bar Chart]
                        F -->|Show distribution| H[Use Histogram]

                        style A fill:#FF8000,stroke:#333,stroke-width:2px
                        style C fill:#66BB6A,stroke:#333,stroke-width:2px
                        style E fill:#42A5F5,stroke:#333,stroke-width:2px
                        style G fill:#66BB6A,stroke:#333,stroke-width:2px
                        style H fill:#42A5F5,stroke:#333,stroke-width:2px
With PageOn.ai, I can transform these fuzzy data classification decisions into clear visual choices instantly. The platform's intelligent algorithms help identify your data type and suggest the most appropriate visualization.
X-Axis Architecture: The Foundation of Your Choice
The x-axis structure is another critical differentiator I always consider. Bar charts offer flexibility – I can reorder categories for maximum impact. Want to show products from highest to lowest sales? Simply rearrange. Need alphabetical order for easy lookup? No problem.
Histograms, however, demand rigid numerical progression. The bins must maintain their mathematical relationship. You can't shuffle age ranges or temperature intervals without destroying the distribution story.
-min.png)
This architectural difference determines your visualization's entire message. Using PageOn.ai's Vibe Creation feature, I can instantly visualize these structural differences and ensure my choice aligns with my data's nature.
Real-World Applications: From Theory to Practice
Bar Chart Excellence Scenarios
Throughout my career, I've found bar charts excel in these scenarios:
Sales Comparisons
Comparing revenue across product lines, regions, or time periods with clear categorical boundaries.
Survey Responses
Visualizing preference data, satisfaction ratings, or multiple-choice responses.
Performance Tracking
Monthly KPIs across departments, team productivity metrics, or project completion rates.
Market Analysis
Competitor comparisons, market share visualization, or brand awareness metrics.
I love creating compelling comparison narratives with PageOn.ai's conversational interface. I simply describe what I want to compare, and the platform generates professional bar charts that tell the story clearly.
Histogram Mastery Situations
Histograms shine when I need to understand distributions. Here are my go-to use cases:
Employee Salary Distribution
Understanding compensation patterns across the organization:
Other powerful histogram applications I've used include:
- Website traffic patterns: Analyzing visitor distribution across hours of the day
- Quality control: Manufacturing measurements and tolerance distributions
- Customer behavior: Purchase amount distributions, session duration analysis
- Scientific data: Temperature readings, test score distributions, reaction times
When I integrate these complex distributions using PageOn.ai's Agentic processes, the platform automatically handles bin optimization and ensures the visualization accurately represents the underlying data patterns.
Common Pitfalls and How to Avoid Them
The Formatting Trap
I've seen countless presentations where the formatting alone revealed a fundamental misunderstanding of these chart types. Let me share the critical rules I always follow:
⚠️ Critical Formatting Rules
- Histogram bars MUST touch - They represent continuous data flow
- Bar chart bars MUST have gaps - They represent discrete categories
- Histogram bar area matters - Width × height = proportional frequency
- Bar chart width is uniform - Only height carries meaning
The proportional area principle in histograms is particularly tricky. If you have unequal bin widths (which sometimes makes sense for your data), the bar heights must adjust so the area remains proportional to the frequency. Miss this, and you've created a misleading visualization.
✓ Correct Bar Chart
- • Gaps between bars
- • Equal bar widths
- • Categories can be reordered
- • Height represents value
✓ Correct Histogram
- • No gaps between bars
- • Width can vary (carefully)
- • Must maintain numerical order
- • Area represents frequency
With PageOn.ai's structured blocks, I can visualize these formatting rules correctly every time. The platform understands these nuances and automatically applies the right formatting based on your data type.
The Misapplication Mistake
The most damaging mistake I see is using the wrong chart type entirely. Let me share some real examples from business contexts where this caused serious misinterpretation:
Real Misapplication Examples
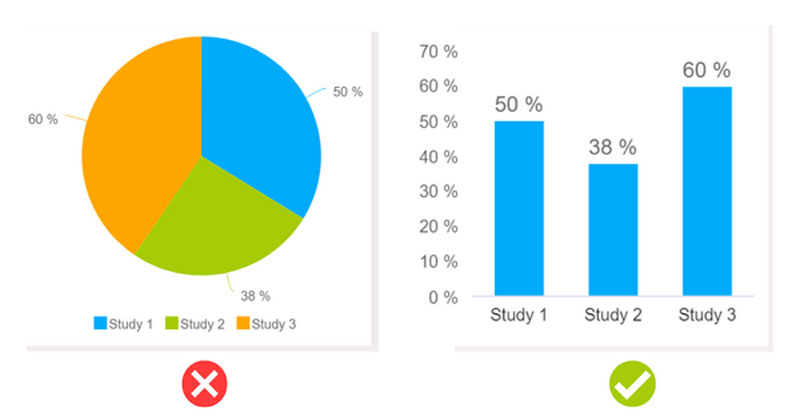
Example 1: A sales team used a histogram for product categories, making it look like products were related on a continuum rather than distinct offerings.
Example 2: An HR department used a bar chart for age distributions with arbitrary groupings, hiding the actual distribution pattern and skewness.
Example 3: A quality control team used separated bars for measurement distributions, making it impossible to see the normal distribution curve.
Transform potential mistakes into polished visuals with PageOn.ai's Plan-Search-Act process. The platform guides you through chart selection, ensuring your visualization matches your data's nature and your communication goals.
Advanced Considerations for Data Professionals
Statistical Analysis Requirements
When I'm doing deep statistical analysis, histograms reveal insights that bar charts simply can't provide. They show me skewness, identify outliers, and reveal the underlying distribution shape – normal, bimodal, or otherwise.
Distribution Shape Analysis
Different distribution patterns revealed through histograms:
Bar charts, on the other hand, excel at quick categorical comparisons. When I need to show which department has the highest sales or compare customer satisfaction across different service channels, bar charts deliver instant clarity.
Sometimes, I combine both chart types for comprehensive data stories. For instance, I might use a bar chart to compare average salaries across departments, then use histograms to show the salary distribution within each department. This multi-layered approach provides both the big picture and the detailed view.
With PageOn.ai, I can create these multi-layered visual narratives effortlessly. The platform understands when to use each visualization type and can even suggest complementary charts for deeper insights.
Customization and Flexibility
The customization options for each chart type reflect their fundamental purposes. Let me share my approach to optimizing each:
Histogram Customization
- Bin width decisions: Affects pattern visibility
- Bin boundaries: Can highlight or hide features
- Overlay curves: Show theoretical distributions
- Color gradients: Emphasize density
Bar Chart Customization
- Sorting strategies: By value, alphabetical, custom
- Color coding: Category groupings or performance
- Annotations: Highlight specific values
- Grouping/Stacking: Show subcategories
Using PageOn.ai's Deep Search feature, I can find and integrate the perfect visual assets automatically. The platform suggests optimal customizations based on data visualization charts best practices.
Making the Right Choice: A Practical Framework
The Decision Tree Approach
After years of creating visualizations, I've developed a simple decision framework that never fails me. Here's my step-by-step approach:
My 4-Step Decision Process
- Identify your data type: Is it categorical (names, types, groups) or continuous (measurements, ranges)?
- Define your analysis goal: Do you want to compare distinct items or understand how data is distributed?
- Consider your audience: Do they need quick comparisons or detailed pattern analysis?
- Test your choice: Would reordering make sense? If yes, use a bar chart. If it would destroy meaning, use a histogram.
Quick Decision Helper
Answer these questions to find your ideal chart:
flowchart TD
                        Start[Your Data] --> Q1{Can you count the
distinct categories?}
                        Q1 -->|Yes: Finite groups| Q2{Are categories
ordered naturally?}
                        Q1 -->|No: Continuous range| Histogram[Use Histogram]

                        Q2 -->|No: Can reorder| BarChart[Use Bar Chart]
                        Q2 -->|Yes: Fixed order| Q3{Is it truly
continuous?}

                        Q3 -->|Yes: Number line| Histogram
                        Q3 -->|No: Discrete ordered| Q4{What's your goal?}

                        Q4 -->|Compare values| BarChart
                        Q4 -->|Show distribution| Histogram

                        style Start fill:#FFE0B2,stroke:#FF8000,stroke-width:2px
                        style BarChart fill:#C8E6C9,stroke:#4CAF50,stroke-width:2px
                        style Histogram fill:#BBDEFB,stroke:#2196F3,stroke-width:2px
Transform this decision process into clear visuals with PageOn.ai's conversational creation. Simply describe your data and goals, and the platform guides you to the right visualization choice.
Quick Reference Guidelines
Here's my cheat sheet that I keep handy for quick decisions:
Choose Bar Chart When:
- ✓ Comparing distinct groups
- ✓ Displaying survey results
- ✓ Showing rankings or top performers
- ✓ Presenting categorical breakdowns
- ✓ Data has natural labels/names
Choose Histogram When:
- ✓ Showing data distribution
- ✓ Analyzing frequencies within ranges
- ✓ Finding patterns in continuous data
- ✓ Identifying outliers or clusters
- ✓ Data represents measurements
Create instant visual guidelines using PageOn.ai's AI Blocks system. The platform helps you build reference materials that your entire team can use for consistent, accurate data visualization.
From Confusion to Visual Mastery
As I reflect on my journey with data visualization, I realize that understanding the difference between bar charts and histograms isn't just about technical accuracy – it's about respecting the story your data wants to tell. Choosing the right visualization tool is critical for effective data-driven decision making.
I've seen firsthand how proper chart selection transforms vague insights into crystal-clear understanding. When we move beyond the "they look similar" trap, we unlock the true power of data storytelling excellence. Each chart type has its unique voice, and knowing when to let each one speak makes all the difference.
Key Takeaways to Remember
- 📊 Bar charts compare categories with gaps between bars
- 📈 Histograms show distributions with touching bars
- 🎯 Your data type determines your visualization choice
- ⚡ The wrong chart type can completely misrepresent your data
- 🚀 Tools like PageOn.ai eliminate guesswork in chart selection
What excites me most about the future of data visualization is how platforms like PageOn.ai are democratizing these skills. No longer do you need years of experience to create professional, accurate visualizations. With intuitive interfaces and intelligent guidance, anyone can transform fuzzy understanding into crystal-clear visual communication.
I encourage you to practice distinguishing between these chart types in your daily work. Look at the visualizations you encounter and ask yourself: Is this the right chart for this data? Could a different visualization tell the story better? This critical thinking will sharpen your data communication skills immeasurably.
Remember, in the world of data visualization, clarity isn't just about making things look good – it's about ensuring your message reaches your audience accurately and effectively. Master the distinction between bar charts and histograms, and you'll have taken a significant step toward becoming a more effective data communicator.
Transform Your Visual Expressions with PageOn.ai
Stop second-guessing your chart choices. Let PageOn.ai's intelligent visualization platform guide you to perfect data presentations every time. Whether you need crystal-clear bar charts for categorical comparisons or insightful histograms for distribution analysis, we've got you covered.
Start Creating with PageOn.ai TodayYou Might Also Like
Essential MCP Tools for Automated Slide Creation and Design | PageOn.ai
Discover essential Model Context Protocol (MCP) tools for automated slide creation and design. Learn how to transform presentation workflows with AI-powered automation.
The Art of Yes Ladders: Building Momentum to Overcome Sales Objections
Discover how to build effective yes ladders in sales conversations to overcome objections and create momentum toward closing deals with proven psychological techniques and strategies.
The Critical Human Element: Mastering AI Tool Selection for Impactful Presentations
Discover how to leverage human judgment when selecting AI presentation tools. Learn to balance automation with creativity for truly impactful, connection-driven presentations.
Crafting Emotionally Resonant Digital Experiences: AI-Powered Vibe Design
Explore how AI-powered vibe design is transforming digital interfaces from functional to emotionally resonant experiences. Learn techniques for creating interfaces that connect with users on a deeper level.