The Ultimate Guide to Choosing the Best Infographic Maker
Transform Your Visual Storytelling in 2025 with the Right Tools
I've spent countless hours testing and comparing the top infographic makers, and I'm here to share my comprehensive insights. From AI-powered solutions to budget-friendly options, let's explore how these tools can revolutionize your visual content strategy—and how innovative platforms like PageOn.ai are pushing the boundaries even further.
Understanding the Modern Infographic Creation Landscape
I remember when creating a professional infographic meant either mastering complex design software or shelling out thousands for agency work. Today, we're witnessing a complete transformation in how visual content is created. The democratization of design has put powerful tools in the hands of millions—Piktochart alone boasts over 14 million users, signaling a massive shift in content creation.

According to comprehensive research from marketing experts, infographics remain one of the most powerful tools for content marketing, social media engagement, and SEO link building. But here's what's changed: you no longer need to be a professional designer to create visuals that capture attention and communicate effectively.
The Evolution Beyond Traditional Design Software
We've moved far beyond the days of struggling with Adobe Illustrator's steep learning curve. Today's infographic makers feature intuitive drag-and-drop interfaces, thousands of professionally designed templates, and increasingly sophisticated AI assistance. This shift has enabled marketers, educators, and business professionals to create stunning infographics that rival agency-quality work.
💡 Key Insight: The rise of AI-powered features in 2025 is transforming how we approach infographic design, with tools like Piktochart's AI generator creating complete infographics from simple prompts in under 10 seconds.
Essential Features That Define Top-Tier Infographic Makers
After testing dozens of platforms, I've identified the critical features that separate exceptional infographic makers from mediocre ones. Let me break down what truly matters when choosing your tool.
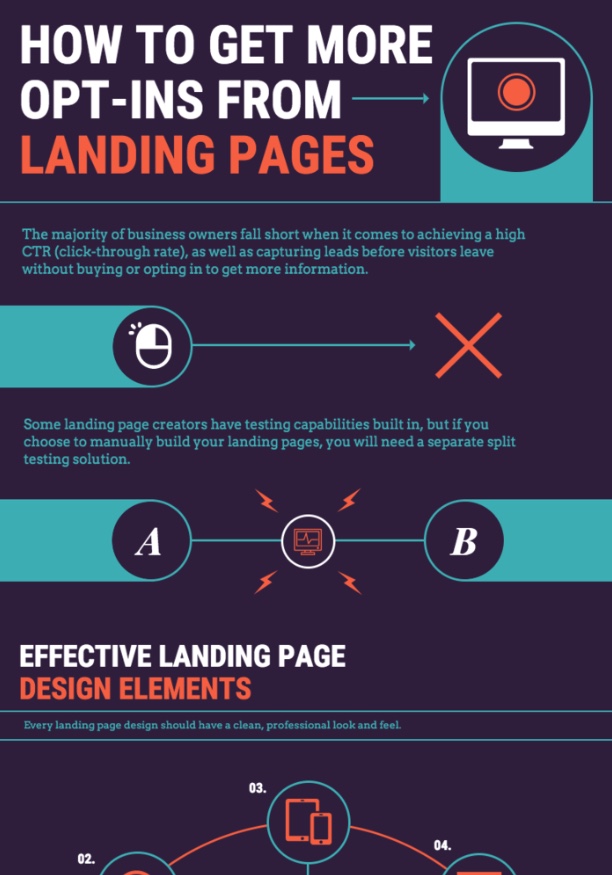
Template Quality and Variety
Statistical Templates
Perfect for data-heavy presentations with charts and graphs
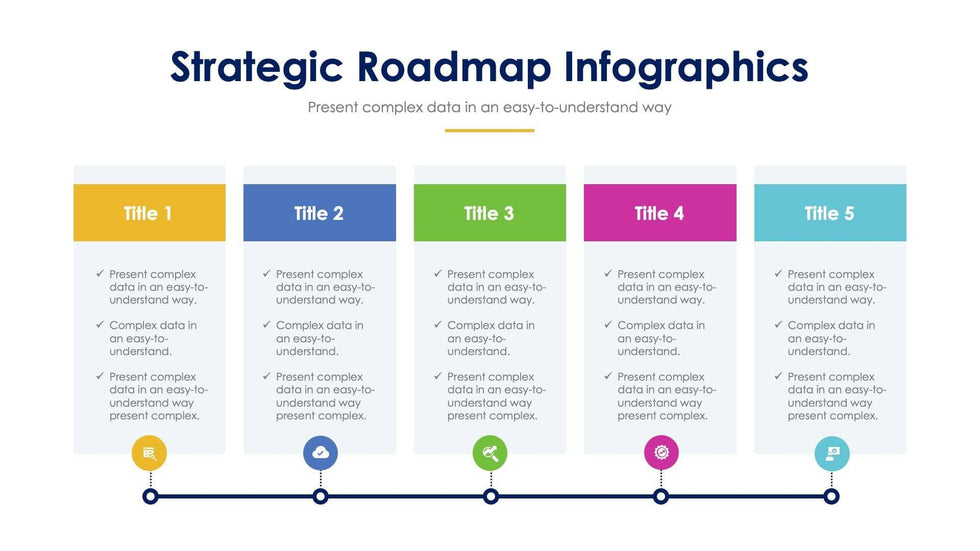
Timeline Templates
Ideal for showing progression, history, or process flows
Comparison Templates
Excellent for side-by-side analysis and decision-making
Process Templates
Great for explaining workflows and methodologies
Data Visualization Capabilities
The best data visualization tools offer more than just basic charts. They provide:
- Diverse chart types (avoiding the dreaded 3D pie charts)
- Real-time data integration from spreadsheets
- Interactive elements for web-based presentations
- Custom color schemes for brand consistency
Feature Comparison Across Top Platforms
Collaboration and Workflow Integration
Modern teams need tools that support real-time collaboration. The best platforms offer:
- Simultaneous editing capabilities
- Commenting and feedback systems
- Version control and history tracking
- Team asset libraries for brand consistency
The Top 15 Infographic Makers: Comprehensive Analysis
I've thoroughly tested each of these platforms, creating actual infographics to understand their strengths and limitations. Here's my detailed breakdown of the market leaders.
Premium Leaders
1. Venngage - The Infographic Specialist
With 7,500+ templates built specifically for infographics, Venngage stands out for its laser focus on visual storytelling. The platform excels in providing diverse, professionally designed templates that cater to every industry.
Pricing: Free to $19/month
Best For: Marketing professionals needing quick, professional results
💡 Pro Tip: Combine Venngage's templates with PageOn.ai's AI Blocks feature to enhance template customization and create truly unique visual narratives.
2. Canva - The All-in-One Giant
Canva's Magic Studio brings AI-powered features to millions of users. While not exclusively focused on infographics, its vast resource library and intuitive interface make it a popular choice.
Pricing: Free to $12.99/month
Best For: Teams needing multiple design capabilities beyond infographics
3. Piktochart - The AI Pioneer
With 14 million users and a new AI infographic generator, Piktochart is pushing boundaries. Their AI can create complete infographics from simple prompts in seconds.
Pricing: Free to $39.99/year for educators
Best For: Educators and professionals wanting AI assistance

Specialized Solutions
Adobe Express
Professional-grade with education focus
$9.99/month
Visme
Business-focused with extensive integrations
$15-29/month
Infogram
Data visualization specialist
$25/month
Budget-Friendly Options
| Tool | Price | Key Feature |
|---|---|---|
| Easel.ly | $2/month (students) | Simplest interface |
| BeFunky | Free with strong features | Photo editing integration |
| Snappa | $10/month | 5M+ stock photos |
| Genially | $9.90/month | Interactive elements |
AI Revolution in Infographic Creation: What's Actually Working
I've been closely following the AI integration in design tools, and 2025 marks a turning point. Let me share what's genuinely useful versus what's still hype.
Current AI Capabilities
AI Feature Evolution in Infographic Tools
flowchart LR
                        A[Text Prompt] --> B[AI Processing]
                        B --> C{Generation Type}
                        C --> D[Template Selection]
                        C --> E[Content Generation]
                        C --> F[Image Creation]
                        D --> G[Customized Template]
                        E --> H[Data Visualization]
                        F --> I[AI-Generated Graphics]
                        G --> J[Final Infographic]
                        H --> J
                        I --> J
                        style A fill:#FF8000,stroke:#333,stroke-width:2px
                        style J fill:#66BB6A,stroke:#333,stroke-width:2px
Piktochart's AI can generate complete infographics from prompts in seconds, but there's a catch—the AI often creates fictional data when you don't provide specific numbers. Canva's Magic Write and Magic Edit offer more controlled AI assistance, focusing on enhancing existing content rather than generating from scratch.
Reality Check: While AI tools are impressive, they work best as assistants rather than replacements for human creativity. The most effective approach combines AI efficiency with human oversight and creativity.
Practical AI Implementation
Here's how I effectively use AI in my infographic creation workflow:
- Start with AI for ideation: Use AI to generate initial concepts and layout suggestions
- Refine with templates: Select a professional template that matches the AI's suggestion
- Enhance with real data: Replace AI-generated placeholders with actual statistics
- Polish with human touch: Add brand elements and ensure accuracy
This is where PageOn.ai's "Turn Fuzzy Thought into Clear Visuals" philosophy becomes particularly valuable. By using conversational creation combined with AI assistance, you can maintain creative control while benefiting from AI efficiency.
Choosing the Right Tool: Decision Framework
After extensive testing, I've developed a framework to help you choose the perfect infographic maker for your specific needs. Let's break it down by use case.
Use Case Scenarios
For Marketers
Priority: Social media integration and brand consistency
Recommended Tools: Canva or Venngage
Key Features: Template variety, brand kit management, social media sizing
💡 PageOn.ai Enhancement: Use Vibe Creation to build compelling narratives that complement your visual designs, ensuring your infographics tell a complete story.
For Educators
Priority: Educational templates and collaboration features
Recommended Tools: Piktochart or Adobe Express
Key Features: Student-friendly pricing, educational content libraries
💡 PageOn.ai Enhancement: Leverage AI Blocks to structure complex educational content into digestible visual segments.
For Data Analysts
Priority: Accurate data visualization and integration
Recommended Tools: Infogram or Google Charts
Key Features: Real-time data updates, advanced chart types
💡 PageOn.ai Enhancement: Use Deep Search to integrate diverse data sources seamlessly into your visualizations.
Cost-Benefit Analysis by User Type
Budget Considerations
I've found that most users can accomplish 80% of their needs with free tiers, but here's when upgrading makes sense:
- Remove watermarks: Essential for professional use
- Access premium templates: Saves significant design time
- Team collaboration: Critical for organizational use
- Higher resolution exports: Necessary for print materials
- Brand kit features: Maintains consistency across designs
Advanced Techniques for Professional Results
Let me share the techniques I've developed over years of creating infographics that not only look professional but also drive real results.
Design Best Practices
Visual Hierarchy
- Use size to indicate importance
- Create clear reading paths with arrows or numbering
- Group related information visually
- Maintain consistent spacing throughout
Color Psychology
- Blue for trust and professionalism
- Orange for energy and creativity
- Green for growth and health
- Limit palette to 3-5 colors maximum
Content Strategy Integration
Creating interactive infographics can significantly boost engagement. Here's my proven strategy:
- SEO Optimization: Include keyword-rich titles and descriptions
- Link Building: Create embeddable versions for easy sharing
- Social Media Adaptation: Design with multiple formats in mind
- Performance Tracking: Use UTM parameters and analytics
- Repurposing Strategy: Break down into micro-content pieces
Pro Tip: Create a master infographic, then extract individual statistics as social media posts. This approach can generate 10-15 pieces of content from a single design.
Workflow Optimization
Efficiency is key when creating infographics at scale. Here's my optimized workflow:
Optimized Infographic Creation Workflow
flowchart TD
                        A[Content Research] --> B[Data Collection]
                        B --> C[Template Selection]
                        C --> D[Initial Design]
                        D --> E{Review}
                        E -->|Needs Revision| F[Iterate Design]
                        F --> E
                        E -->|Approved| G[Export Multiple Formats]
                        G --> H[Distribution]
                        H --> I[Performance Tracking]
                        I --> J["Archive & Document"]
                        style A fill:#FF8000,stroke:#333,stroke-width:2px
                        style G fill:#42A5F5,stroke:#333,stroke-width:2px
                        style J fill:#66BB6A,stroke:#333,stroke-width:2px
Future-Proofing Your Visual Content Strategy
The landscape of visual content creation is evolving rapidly. Here's how I'm preparing for what's next and how you can too.
Emerging Trends
Interactive and Animated Infographics
Tools like Genially and Animaker are making it easier to add motion and interactivity. Viewers can now engage with data points, revealing additional information on hover or click.
Video Infographics
Biteable and Animaker specialize in transforming static infographics into engaging videos, perfect for social media consumption.
AR/VR Integration
Early experiments show potential for immersive data visualization experiences, though mainstream adoption is still developing.
Building a Sustainable Creation Process
Success with infographics isn't about one-off creations—it's about building a sustainable system. Here's how I've structured mine:
- Template Library: Develop brand-specific templates for consistency
- Asset Repository: Maintain organized folders of icons, images, and data
- Style Guide: Document color codes, fonts, and design principles
- Feedback Loop: Track performance metrics to inform future designs
- Team Training: Regular workshops on new features and best practices
Leveraging PageOn.ai's Unique Advantages
What sets PageOn.ai apart is its conversational approach to visual creation. Instead of wrestling with complex software, you can describe what you want to communicate, and the platform helps transform those ideas into clear visual expressions.
The platform's ability to integrate diverse data sources through Deep Search means you're not limited to manual data entry—you can pull from multiple sources to create comprehensive infographic data visualizations that tell complete stories.
Implementation Roadmap and Next Steps
Ready to start creating professional infographics? Here's your actionable roadmap to go from beginner to proficient in record time.
Quick Start Guide: Your First 30-Minute Infographic
- Minutes 1-5: Define your core message and target audience
- Minutes 6-10: Gather your data and key statistics
- Minutes 11-15: Select a template that matches your content type
- Minutes 16-25: Customize the template with your content
- Minutes 26-30: Review, refine, and export
Essential Elements Checklist
✅ Must-Have Elements
- ☐ Compelling headline
- ☐ Clear data sources
- ☐ Visual hierarchy
- ☐ Brand consistency
- ☐ Call-to-action
❌ Common Pitfalls to Avoid
- ☐ Information overload
- ☐ Inconsistent styling
- ☐ Poor color contrast
- ☐ Missing attribution
- ☐ Low-resolution exports
Scaling Your Efforts
Once you've mastered the basics, it's time to scale. Here's my proven approach:
Infographic Creation Maturity Journey
flowchart LR
                        A["Month 1
Single Infographics"] --> B["Month 2-3
Template Library"]
                        B --> C["Month 4-6
Content Series"]
                        C --> D["Month 7-12
Full Campaigns"]
                        D --> E["Year 2+
Automated Workflows"]
                        style A fill:#FFE0B2,stroke:#FF8000,stroke-width:2px
                        style E fill:#C8E6C9,stroke:#66BB6A,stroke-width:2px
Resources for Continued Learning
Community and Inspiration
Join design communities on platforms like Dribbble and Behance. Study what works and adapt techniques to your style.
Professional Development
Consider courses on data visualization and visual storytelling. Many platforms offer free webinars and certification programs.
Stay Updated
Follow tool updates and new feature releases. The landscape changes quickly, and early adopters often gain competitive advantages.
Transform Your Visual Expressions with PageOn.ai
While traditional infographic makers require you to work within rigid templates and complex interfaces, PageOn.ai revolutionizes the process with conversational creation. Imagine describing your ideas in plain language and watching them transform into stunning visual narratives—no design skills required.
Join thousands of professionals who are already using PageOn.ai to create compelling visual content that goes beyond static infographics. Our AI-powered platform understands context, suggests optimal visualizations, and helps you tell stories that resonate.
Start Creating with PageOn.ai TodayYour Journey to Visual Storytelling Mastery
We've covered a lot of ground in this comprehensive guide. From understanding the modern infographic landscape to mastering advanced techniques, you now have the knowledge to choose and use the best tools for your needs.
Remember, the best infographic maker isn't necessarily the one with the most features—it's the one that fits your workflow, budget, and creative vision. Whether you choose the template-rich environment of Venngage, the AI-powered innovation of Piktochart, or the versatility of Canva, success comes from understanding your audience and crafting visual stories that resonate.
As we move forward, the lines between traditional design tools and AI-powered platforms will continue to blur. Platforms like PageOn.ai are showing us that the future of visual content creation isn't just about better templates or more features—it's about fundamentally reimagining how we transform ideas into visual expressions.
Final Thought: The tools we've explored today are powerful, but they're just instruments. Your creativity, understanding of your audience, and commitment to clear communication are what will truly make your infographics stand out. Start with one tool, master its basics, and gradually expand your capabilities. The world of visual storytelling is waiting for your unique perspective.
Ready to begin? Pick your tool, grab your data, and start creating. Your audience is waiting for the insights only you can provide, presented in ways that inform, engage, and inspire.
You Might Also Like
Print vs Digital Design: Navigating Today's Hybrid Market Landscape
Explore the evolving relationship between print and digital design disciplines, with insights on market trends, strategic applications, and essential skills for cross-disciplinary designers.
Harnessing Creative Tension: Strategic Conflict in Experience Design | PageOn.ai
Discover how to intentionally use conflict as a creative catalyst in experience design. Learn techniques for implementing productive tension that transforms friction into innovative solutions.
Mastering the Three-Body Structure for Compelling Business Presentations | PageOn.ai
Transform ordinary business presentations into compelling visual narratives using the three-body storytelling structure. Learn techniques for creating impactful openings, persuasive middles, and inspiring closings.
Typography Evolution: From Cave Paintings to Digital Fonts | Visual Journey
Explore typography's rich evolution from ancient cave paintings to modern digital fonts. Discover how visual communication has transformed across centuries and shaped design.