Transform Your Data Story: Creating Professional Pie Charts Beyond Canva's Templates
The Evolution of Pie Chart Creation
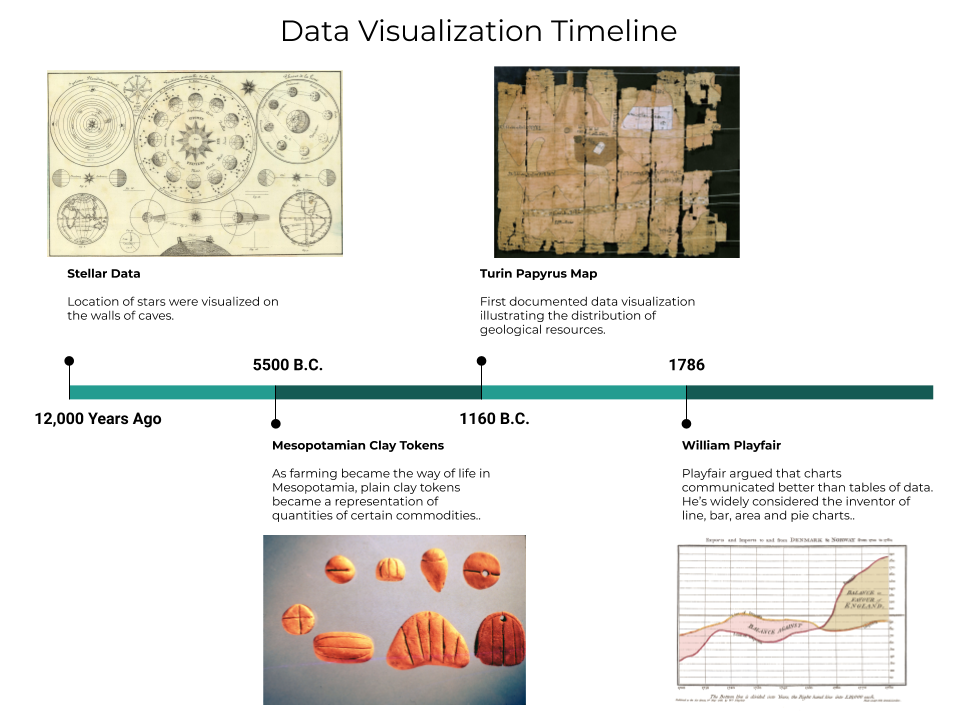
I've watched the landscape of data visualization transform dramatically. From manual spreadsheet charts to drag-and-drop design tools, we're now entering an era where AI understands our data stories and creates stunning visuals instantly. Let me guide you through this evolution and show you how to create pie charts that truly captivate your audience.
The Evolution of Pie Chart Creation
I've witnessed firsthand how the landscape of data visualization has transformed over the years. We've moved from painstakingly creating charts in spreadsheet software to the revolutionary drag-and-drop interfaces that Canva popularized. This shift democratized design, allowing anyone to create professional-looking pie charts without extensive training.
Yet, as I've worked with countless data presentations, I've discovered that template-based approaches often fall short when dealing with complex data narratives. The real challenge isn't just making a pie chart – it's crafting a visual story that resonates with your audience.
Today, modern AI tools like PageOn.ai's Vibe Creation are pushing boundaries even further. Imagine describing your data in natural language and watching as polished, professional visualizations appear instantly. This isn't just an incremental improvement – it's a fundamental shift in how we approach data storytelling.
Breaking Down the Traditional Pie Chart Workflow
Let me walk you through the typical Canva process I've used countless times: selecting templates, manually inputting data, and adjusting colors. While this approach works, I've found it often becomes a bottleneck in fast-paced environments where data changes frequently.
Data Input Challenges
- • Managing CSV, TSV, and XLSX file uploads becomes tedious with multiple data sources
- • The disconnect between data sources and visual output creates workflow friction
- • Manual percentage calculations and label formatting consume valuable time
- • Updating frequently changing data requires starting from scratch
Traditional Pie Chart Creation Process
Here's how the conventional workflow typically unfolds:
flowchart TD
                        A[Gather Data] --> B[Open Design Tool]
                        B --> C[Select Template]
                        C --> D[Manual Data Entry]
                        D --> E[Adjust Colors/Fonts]
                        E --> F[Export Chart]
                        F --> G{Data Changes?}
                        G -->|Yes| A
                        G -->|No| H[Final Output]

                        style A fill:#FF8000,stroke:#333,stroke-width:2px
                        style H fill:#66BB6A,stroke:#333,stroke-width:2px
Design Customization Bottlenecks
I've encountered numerous design challenges when working within preset templates:
- • Working within preset template constraints limits creative expression
- • Balancing aesthetics with data accuracy requires constant adjustments
- • Font size and segment visibility issues plague complex datasets
- • Creating cohesive visual narratives across multiple charts demands extensive manual coordination
Reimagining Data Visualization with AI-Powered Solutions
Voice-to-Visual Revolution
I've been amazed by how PageOn.ai's Vibe Creation transforms the entire process. Instead of clicking through menus and manually entering data, I simply describe what I need:
- ✓ Transform spoken data insights into structured pie charts instantly
- ✓ Skip manual data entry entirely – describe your data distribution naturally
- ✓ Let AI handle mathematical calculations and proportional representations
- ✓ Focus on storytelling while AI manages technical visualization aspects

Building Complex Data Stories with AI Blocks
PageOn.ai's LEGO-like block system has revolutionized how I create comprehensive presentations. I can now:
- • Combine pie charts with supporting visuals seamlessly
- • Create multi-layered presentations beyond single chart displays
- • Integrate data visualization charts into comprehensive reports
- • Build interactive dashboards without learning complex software
Intelligent Asset Integration
The Deep Search feature in PageOn.ai has transformed how I enhance my visualizations:
- • Automatically find relevant icons and images for chart segments
- • Enhance pie charts with contextual visuals that reinforce data points
- • Connect to real-time data sources without manual updates
- • Create branded visualizations maintaining consistency across all materials
Advanced Techniques for Professional Pie Charts
Choosing Between Visualization Types
I've learned that selecting the right chart type is crucial for effective communication:
- • Understand when to use pie charts vs donut charts
- • Consider the psychology of circular data representation
- • Optimize segment counts for clarity
- • Know when alternative visualizations work better
AI-Enhanced Chart Creation
Modern AI pie chart generators offer capabilities I never imagined:
- • Natural language commands for instant modifications
- • Automatic color palette selection based on data meaning
- • Smart labeling that adapts to available space
- • Context-aware chart recommendations
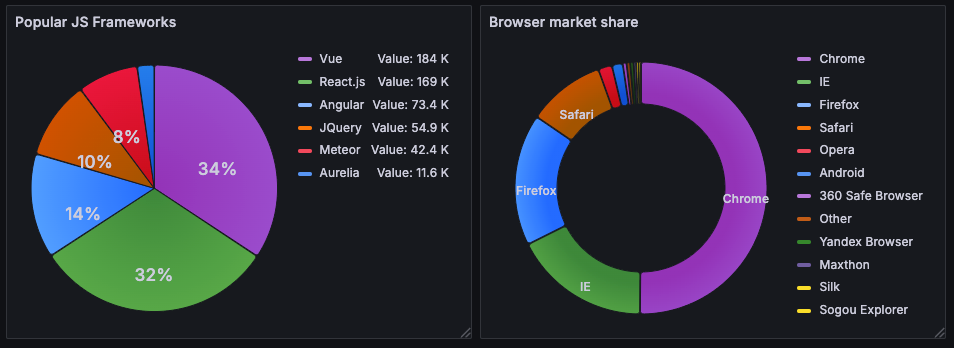
Market Share Distribution Example
Here's how modern tools help visualize competitive landscapes:
Practical Implementation Strategies
Workflow Optimization
I've streamlined my entire visualization process by integrating AI chart generators into my workflow:
- 1. Create reusable chart styles with PageOn.ai's Agentic features
- 2. Establish data visualization standards for team consistency
- 3. Automate report generation with intelligent templates
- 4. Maintain version control through AI-managed iterations
Real-World Applications
- • Sales performance dashboards with dynamic pie charts
- • Budget allocation visualizations for stakeholder presentations
- • Market share analysis with interactive segments
- • Survey results that tell compelling stories
Collaboration and Iteration
- • Use PageOn.ai's conversational interface for team feedback
- • Rapidly prototype different data perspectives
- • Share interactive charts viewers can explore
- • Maintain version control through AI-managed iterations
Modern AI-Powered Workflow
Here's how I've transformed my chart creation process:
flowchart LR
                        A[Describe Data] --> B[AI Generates Options]
                        B --> C["Select & Refine"]
                        C --> D[Auto-Update]
                        D --> E[Share Interactive]

                        style A fill:#FF8000,stroke:#333,stroke-width:2px
                        style B fill:#42A5F5,stroke:#333,stroke-width:2px
                        style C fill:#66BB6A,stroke:#333,stroke-width:2px
                        style D fill:#AB47BC,stroke:#333,stroke-width:2px
                        style E fill:#FFA726,stroke:#333,stroke-width:2px
Beyond Basic Charts: Creating Comprehensive Visual Narratives
Multi-Chart Compositions
I've discovered that combining different visualization types creates more powerful insights:
- • Combine pie charts with AI-powered bar chart generators for complete analysis
- • Create visual flow between different data representations
- • Use PageOn.ai's AI Blocks to structure complex information hierarchies
- • Build presentations that guide viewers through data insights naturally
Traditional vs AI-Powered Chart Creation
Time investment comparison for creating professional pie charts:
Interactive and Animated Elements
Modern visualization tools have opened up new possibilities for engagement:
- ✓ Transform static pie charts into engaging visual experiences
- ✓ Implement hover effects and clickable segments using PageOn.ai's Agentic capabilities
- ✓ Create animated transitions between data states
- ✓ Design charts that reveal information progressively
Future-Proofing Your Data Visualization Strategy
As I look ahead, I see the landscape of data visualization continuing to evolve rapidly. The shift from manual chart creation to AI-assisted visualization isn't just a trend – it's the future of how we'll communicate with data.

Key Strategies for the Future
-
→
Move beyond manual creation: Embrace AI-assisted visualization tools that understand context and intent
-
→
Maintain data-design flexibility: Choose platforms that adapt to changing requirements without starting over
-
→
Build scalable systems: Leverage PageOn.ai's platform for visualization workflows that grow with your needs
-
→
Prepare for real-time integration: Implement systems that connect directly to live data sources
-
→
Create adaptive workflows: Design processes that evolve with changing business needs
The Path Forward
I believe the future of data visualization lies in tools that understand not just our data, but our intent. PageOn.ai represents this shift perfectly – it's not just about creating pie charts faster, it's about transforming how we think about visual communication.
By embracing these AI-powered approaches, we're not replacing creativity – we're amplifying it. We can focus on crafting compelling narratives while intelligent systems handle the technical execution. This is the future I'm excited about, and it's available today.
Transform Your Visual Expressions with PageOn.ai
Ready to move beyond traditional pie chart makers? Experience the power of AI-driven visualization that understands your data story and creates stunning visuals in seconds. Join thousands who've already revolutionized their data presentations.
Start Creating with PageOn.ai TodayYou Might Also Like
Five Core Primitives That Power Modern AI Connectivity - Visual Guide
Explore the fundamental building blocks enabling modern AI systems to communicate: memory stores, context management, tool APIs, data movement, and agent coordination primitives visualized.
Mastering Content Rewriting: How Gemini's Smart Editing Transforms Your Workflow
Discover how to streamline content rewriting with Gemini's smart editing capabilities. Learn effective prompts, advanced techniques, and workflow optimization for maximum impact.
Building Powerful Real-World AI Applications with PostgreSQL and Claude | PageOn.ai
Learn how to build sophisticated AI applications by integrating PostgreSQL and Claude AI. Discover architecture patterns, implementation techniques, and optimization strategies for production use.
Creating Immersive Worlds: The Art of Color and Atmosphere in Visual Storytelling
Discover how to build magical worlds using color psychology and atmospheric elements. Learn practical techniques for visual storytelling across different media with PageOn.ai's innovative tools.