Maximizing Conversion Rates Through Strategic Visual Content
Transform Your Marketing Funnel with Powerful Visual Strategies
In today's digital landscape, visual content has become the cornerstone of effective marketing funnels. I've seen firsthand how strategically implemented visuals can dramatically increase conversion rates at every stage of the customer journey. Let me show you how to harness the power of visual content to transform your marketing funnel and drive meaningful results.
Understanding the Conversion Funnel in Today's Visual-First World
When I first started exploring marketing funnels, I quickly realized that the traditional text-heavy approach was becoming increasingly ineffective. Today's consumers are bombarded with information, and visual content has emerged as the most powerful way to cut through the noise. Let me walk you through how the modern conversion funnel has evolved to prioritize visual elements.
The Modern Conversion Funnel
Below is a visualization of today's visual-centric marketing funnel:
                    flowchart TD
                        A[AWARENESS] --> B[INTEREST]
                        B --> C[DESIRE]
                        C --> D[ACTION]

                        style A fill:#FF8000,stroke:#333,stroke-width:1px,color:white
                        style B fill:#FF9A3D,stroke:#333,stroke-width:1px,color:white
                        style C fill:#FFB067,stroke:#333,stroke-width:1px,color:white
                        style D fill:#FFC691,stroke:#333,stroke-width:1px,color:white

                        A1[Eye-catching infographics] --> A
                        A2[Scroll-stopping videos] --> A
                        A3[Vibrant social media visuals] --> A

                        B1[Interactive product demos] --> B
                        B2[Educational video content] --> B
                        B3[Visual comparisons] --> B

                        C1[Customer success visuals] --> C
                        C2[Product visualization] --> C
                        C3[Interactive pricing tools] --> C

                        D1[Visual CTAs] --> D
                        D2[Checkout process visuals] --> D
                        D3[Trust indicators] --> D
The psychological impact of visual content on decision-making cannot be overstated. Our brains process visual information 60,000 times faster than text, making visuals the perfect medium for guiding prospects through each stage of the conversion funnel. Visual content creates emotional connections, builds trust, and simplifies complex information—all critical elements for moving prospects toward conversion.
Visual vs. Text Processing
The following chart shows how our brains process different types of content:
Traditional text-heavy funnels are losing effectiveness because today's consumers are increasingly visual learners with shorter attention spans. In my experience, when prospects encounter walls of text rather than engaging visuals, bounce rates increase dramatically and conversion rates plummet. The modern marketing funnel must leverage visual content at every stage to maintain engagement and guide prospects toward conversion.

As we move through each stage of the funnel, I'll show you exactly how to implement visual content strategies that address specific challenges and opportunities at each level. The key is understanding that different types of visual content serve different purposes throughout the customer journey.
Top-of-Funnel: Visual Content Strategies for Awareness
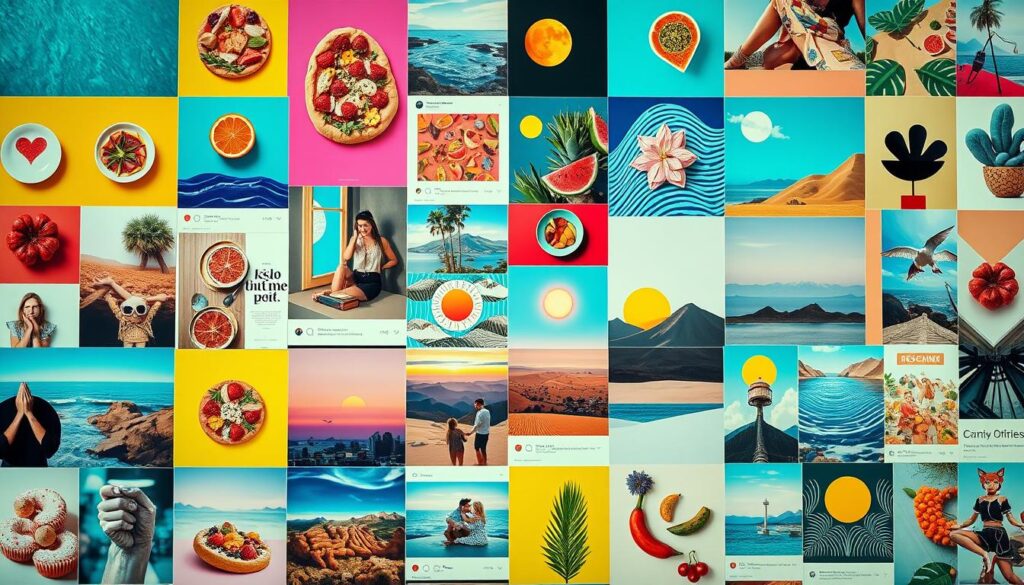
The awareness stage is where I've seen the most dramatic impact from strategic visual content. With digital spaces becoming increasingly crowded, creating scroll-stopping visuals is no longer optional—it's essential for capturing attention and initiating the customer journey.
Creating Scroll-Stopping Visual Content
To capture attention in today's crowded digital spaces, I focus on creating visuals with these key elements:
- Bold, contrasting colors that align with brand identity
- Unexpected visual elements that interrupt passive scrolling
- Motion graphics that naturally draw the eye
- Visuals that evoke emotion or curiosity
- Clear visual hierarchy that communicates value instantly
Developing Cohesive Visual Identities
Using PageOn.ai's Vibe Creation tools, I've helped brands develop visual identities that instantly resonate with their target audiences. The key is consistency with distinction—creating a visual language that's both recognizable and memorable.
Visual Identity Components
                        flowchart LR
                            VID[Visual Identity] --> C[Color Palette]
                            VID --> T[Typography]
                            VID --> I[Imagery Style]
                            VID --> IC[Iconography]
                            VID --> A[Animation Style]

                            C --> CR[Brand Recognition]
                            T --> CR
                            I --> CR
                            IC --> CR
                            A --> CR

                            CR --> CON[Conversion Lift]

                            style VID fill:#FF8000,stroke:#333,stroke-width:1px,color:white
                            style CR fill:#FFB067,stroke:#333,stroke-width:1px,color:white
                            style CON fill:#FFC691,stroke:#333,stroke-width:1px,color:white
Implementing Data Visualization
One of the most effective top-of-funnel strategies I've implemented is using data visualization to communicate complex value propositions instantly. When prospects can immediately grasp the potential impact of your solution, they're much more likely to enter your funnel.
Impact of Visual Content on Funnel Entry Rates
Case Study: 30%+ Increase in Funnel Entry Rates
I worked with a SaaS company that was struggling with low awareness despite having an excellent product. By implementing a comprehensive visual content strategy at the top of their funnel, we achieved remarkable results:
- Replaced text-heavy social posts with branded infographics
- Created a series of 30-second explainer videos
- Developed interactive data visualizations demonstrating ROI
- Implemented consistent visual branding across all channels
The results were dramatic: a 37% increase in funnel entry rates and a 42% increase in qualified leads entering the middle funnel stages.
Leveraging Interactive Content Marketing
I've found that interactive content marketing is particularly effective at the top of the funnel. Interactive elements not only capture attention but also begin building engagement from the very first touchpoint. Interactive quizzes, assessments, calculators, and configurators all serve to draw prospects into active participation with your brand.
Middle-of-Funnel: Nurturing Interest and Desire Through Visual Storytelling
Once I've captured a prospect's attention, the middle of the funnel becomes critical for nurturing that initial interest into genuine desire. This is where visual storytelling becomes particularly powerful, transforming complex product information into engaging narratives that maintain and deepen engagement.
Transforming Complex Information into Visual Narratives
In my experience, the middle of the funnel is where many brands lose prospects due to information overload. The solution is transforming complex product details into visual narratives that are both informative and engaging:
Visual Narrative Structure
                        flowchart TD
                            A[Identify Customer Problem] --> B[Visualize Pain Points]
                            B --> C[Introduce Solution Components]
                            C --> D[Show Transformation]
                            D --> E[Visualize Outcomes]

                            style A fill:#FF8000,stroke:#333,stroke-width:1px,color:white
                            style B fill:#FF9A3D,stroke:#333,stroke-width:1px,color:white
                            style C fill:#FFB067,stroke:#333,stroke-width:1px,color:white
                            style D fill:#FFC691,stroke:#333,stroke-width:1px,color:white
                            style E fill:#FFDBBA,stroke:#333,stroke-width:1px,color:white
Using PageOn.ai's AI Blocks, I create sequential visual explanations that maintain engagement while communicating complex information. This approach breaks down complicated concepts into digestible visual segments that guide prospects through a logical progression.

Implementing Visual Advertising Techniques
I've found that implementing effective visual advertising techniques is crucial for moving prospects deeper into the funnel. These techniques focus on creating emotional connections and addressing specific pain points through visual storytelling.
Effectiveness of Visual Techniques in Middle Funnel
Creating Visual Comparison Content
At the middle funnel stage, prospects are actively comparing options. I've found that visual comparison content is incredibly effective at building preference and overcoming objections:
| Comparison Type | Visual Format | Effectiveness | Best For |
|---|---|---|---|
| Side-by-side feature comparison | Interactive table or matrix | High | Feature-focused products |
| Before/after transformation | Split-screen imagery or slider | Very High | Transformational products |
| Process comparison | Animated flowcharts | Medium-High | Efficiency-focused solutions |
| Value comparison | Interactive calculators | High | Investment-heavy decisions |
Integrating Customer Journey Insights
I've found that the most effective middle-funnel visual content is developed by integrating customer journey insights. By identifying specific pain points and questions that arise at this stage, I can create targeted visual content that addresses these concerns directly.

Using visual sales solutions that directly address customer pain points has proven to be one of the most effective strategies for moving prospects from interest to desire.
Bottom-of-Funnel: Visual Conversion Catalysts
At the bottom of the funnel, my focus shifts to creating visual content that catalyzes the final decision to convert. This is where strategic visual elements can have the most direct impact on conversion rates and revenue.
Designing High-Converting Visual CTAs
Through extensive testing, I've identified several key principles for designing visual CTAs that drive conversions:
Color Psychology
Use high-contrast colors that stand out from the surrounding content. Orange, red, and green typically perform best for CTAs, but the key is contrast with your page design.
Directional Cues
Subtle visual cues like arrows or eye direction in images can guide attention to your CTA, increasing click-through rates by up to 25%.
Button Design
3D or "floating" button styles that create a sense of depth have shown to increase click rates compared to flat designs in my testing.
Visual Hierarchy
Ensure your CTA is the most visually prominent element on the page, using size, color, and whitespace to create visual priority.
Using PageOn.ai's Deep Search for Social Proof
Social proof is one of the most powerful conversion catalysts, and visual social proof is particularly effective. Using PageOn.ai's Deep Search functionality, I can incorporate compelling social proof visuals that address final purchase hesitations:
- Customer success story visualizations
- Before/after results with real customer data
- Visual testimonials with customer photos and metrics
- Trust badges and certification visuals
- User-generated content showcasing product benefits
Impact of Visual Social Proof on Conversion Rates
Creating Visual Sales Solutions
At the bottom of the funnel, I focus on creating visual sales solutions that address final purchase hesitations. These visuals directly tackle common objections and provide the reassurance needed to complete the conversion:
Addressing Purchase Hesitations
                        flowchart TD
                            H[Purchase Hesitations] --> P[Price Concerns]
                            H --> R[Risk Concerns]
                            H --> V[Value Uncertainty]
                            H --> T[Trust Issues]

                            P --> PV[Visual Price Comparison]
                            R --> RV[Visual Risk Mitigation]
                            V --> VV[Visual Value Demonstration]
                            T --> TV[Visual Trust Builders]

                            PV --> C[Conversion]
                            RV --> C
                            VV --> C
                            TV --> C

                            style H fill:#FF8000,stroke:#333,stroke-width:1px,color:white
                            style C fill:#FF8000,stroke:#333,stroke-width:1px,color:white
A/B Testing Visual Conversion Elements
I've developed a comprehensive framework for A/B testing visual conversion elements to maximize bottom-funnel performance:
| Element | Variables to Test | Key Metrics | Average Lift |
|---|---|---|---|
| CTA Buttons | Color, size, shape, shadow | Click rate, conversion rate | 15-25% |
| Product Images | Angle, context, zoom level | Time on page, conversion rate | 10-30% |
| Trust Indicators | Placement, size, style | Form completions, cart abandonment | 5-15% |
| Visual Pricing Tables | Highlight color, feature visualization | Plan selection, upgrade rate | 20-40% |
Case Study: 45% Conversion Rate Increase
I worked with an e-commerce client to optimize their bottom-funnel visual elements through systematic A/B testing. The process focused on their product pages and checkout flow:
- Replaced static product images with interactive 360° views
- Added visual size comparison tools to reduce return rates
- Implemented visual progress indicators in the checkout flow
- Created animated "what's included" visuals for bundles
These changes resulted in a 45% increase in conversion rate and a 23% increase in average order value.
Cross-Funnel Visual Content Integration
In my experience, one of the most powerful approaches to conversion optimization is developing integrated visual content ecosystems that maintain consistency across all funnel stages. This creates a seamless experience that guides prospects naturally from awareness to conversion.
Developing Visual Content Ecosystems
A visual content ecosystem ensures that prospects experience a cohesive brand story regardless of where they enter your funnel:
Visual Content Ecosystem
                        flowchart TD
                            VB[Visual Brand System] --> A[Awareness Stage]
                            VB --> I[Interest Stage]
                            VB --> D[Desire Stage]
                            VB --> AC[Action Stage]

                            A --> A1[Social Media Visuals]
                            A --> A2[Paid Ad Visuals]
                            A --> A3[Content Marketing Visuals]

                            I --> I1[Email Visuals]
                            I --> I2[Website Visuals]
                            I --> I3[Video Content]

                            D --> D1[Case Study Visuals]
                            D --> D2[Comparison Visuals]
                            D --> D3[Product Demo Visuals]

                            AC --> AC1[Checkout Visuals]
                            AC --> AC2[CTA Visuals]
                            AC --> AC3[Trust Visuals]

                            style VB fill:#FF8000,stroke:#333,stroke-width:1px,color:white
                            style A fill:#FF9A3D,stroke:#333,stroke-width:1px,color:white
                            style I fill:#FFB067,stroke:#333,stroke-width:1px,color:white
                            style D fill:#FFC691,stroke:#333,stroke-width:1px,color:white
                            style AC fill:#FFDBBA,stroke:#333,stroke-width:1px,color:white
Using PageOn.ai's Agentic Capabilities
One of the most powerful tools I've used for cross-funnel integration is PageOn.ai's Agentic capabilities, which allow for adapting visual content based on user behavior patterns. This creates a dynamic visual experience that responds to individual user journeys:

The system analyzes user interaction patterns and dynamically adjusts visual content to match their position in the funnel and specific interests. This personalization significantly increases engagement and conversion rates.
Creating Seamless Visual Transitions
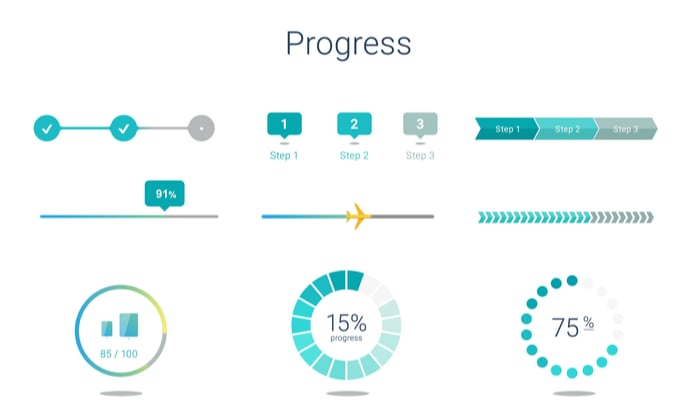
Seamless visual transitions between funnel stages are critical for maintaining momentum and preventing drop-offs. I focus on creating visual bridges that connect each stage:
Visual Callbacks
Repeating and evolving visual elements from earlier funnel stages creates recognition and reinforces key messages.
Progressive Disclosure
Gradually revealing more detailed visuals as users move deeper into the funnel maintains interest and creates anticipation.
Visual Breadcrumbs
Subtle visual indicators that show progress through the funnel create a sense of accomplishment and momentum.
Implementing Interactive Video Marketing
I've found that interactive video marketing is one of the most effective strategies for guiding users through the entire funnel. Interactive video allows prospects to self-navigate through content based on their specific interests and concerns:
Interactive vs. Standard Video Performance
Interactive videos allow prospects to choose their own path through your content, creating a personalized experience that addresses their specific questions and concerns. This self-directed exploration leads to higher engagement and conversion rates compared to traditional linear video content.
Data-Driven Visual Content Optimization
In my experience, the most effective visual content strategies are built on a foundation of continuous data-driven optimization. By measuring performance and iterating based on insights, I ensure that visual content consistently drives conversion improvements.
Essential Metrics for Visual Content Performance
I track different metrics for visual content at each funnel stage to ensure optimization efforts are properly focused:
| Funnel Stage | Primary Metrics | Secondary Metrics |
|---|---|---|
| Awareness |
|
|
| Interest |
|
|
| Desire |
|
|
| Action |
|
|
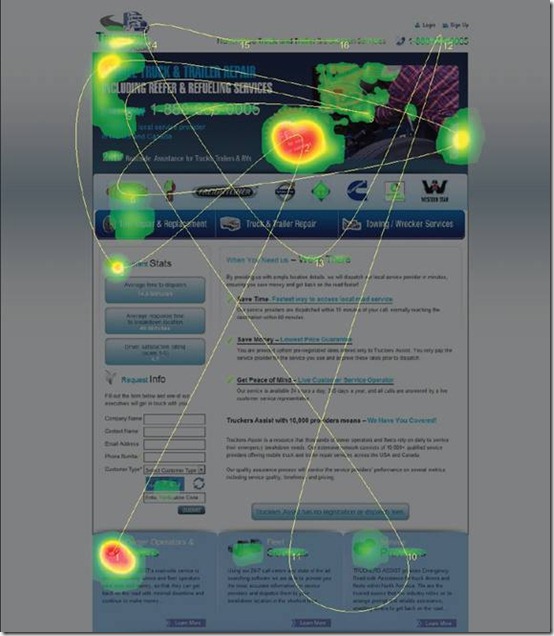
Using Heatmaps and Eye-Tracking
I've found that heatmaps and eye-tracking studies provide invaluable insights for refining visual elements for maximum impact:
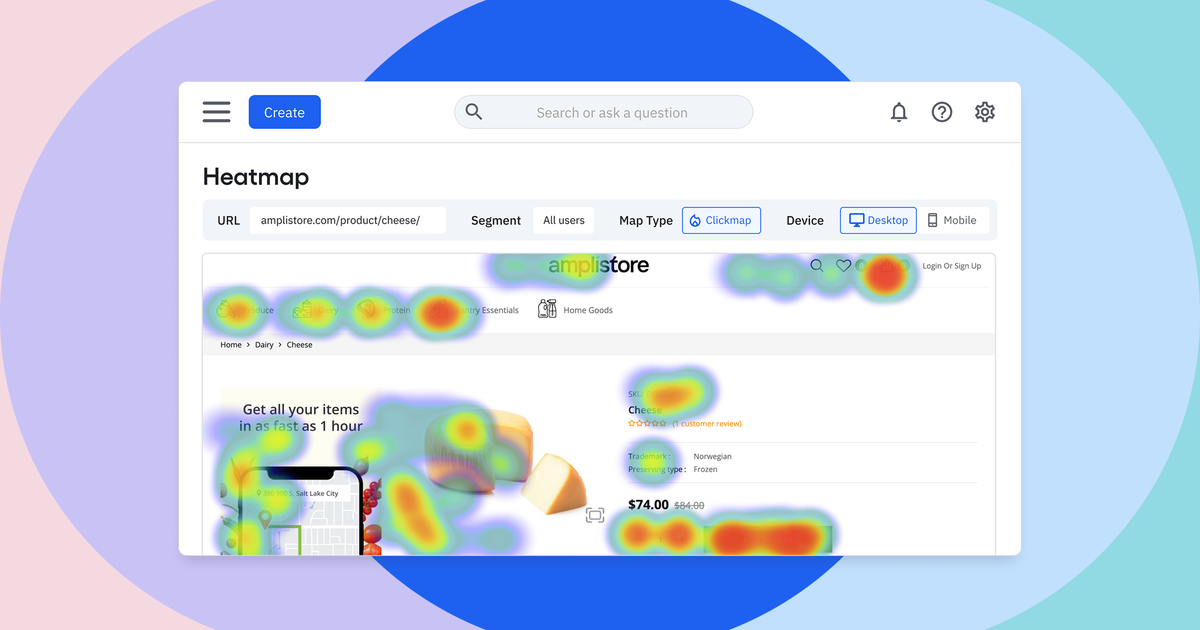
These tools reveal how users actually interact with visual content, allowing for data-driven refinements to layout, color, size, and positioning. Key insights I often discover include:
- The optimal placement for key visual elements based on natural eye movement patterns
- Which visual elements receive the most attention and which are being overlooked
- How visual hierarchy is actually perceived vs. how it was intended
- Whether CTAs are receiving sufficient visual attention
- If important information is being missed due to banner blindness or other visual perception issues
Implementing A/B Testing Protocols
I implement systematic A/B testing specifically for visual content elements to continuously improve performance:
Visual A/B Testing Process
                        flowchart LR
                            A[Identify Visual Element] --> B[Form Hypothesis]
                            B --> C[Create Variant]
                            C --> D[Run Test]
                            D --> E[Analyze Results]
                            E --> F[Implement Winner]
                            F --> G[Document Insights]
                            G --> A

                            style A fill:#FF8000,stroke:#333,stroke-width:1px,color:white
                            style F fill:#FF8000,stroke:#333,stroke-width:1px,color:white
This continuous testing cycle ensures that visual content is constantly being refined and optimized based on actual user behavior rather than assumptions.
Using PageOn.ai for Rapid Iteration
One of the most powerful tools in my optimization toolkit is PageOn.ai's ability to rapidly iterate visual content based on performance insights:
PageOn.ai Iteration Process
- Import performance data from analytics platforms
- Identify underperforming visual elements
- Generate multiple visual variations based on successful patterns
- Preview variations in context
- Deploy variants for testing
- Analyze results and implement winners
- Create documentation of visual optimization insights
This iterative approach allows for continuous improvement of visual content across the entire funnel, ensuring that conversion rates continue to improve over time rather than stagnating after initial optimization efforts.
Building a Digital Marketing Pitch Deck That Showcases Your Visual Funnel Strategy
Once you've developed a comprehensive visual content strategy for your conversion funnel, it's essential to effectively communicate this approach to stakeholders and clients. I've found that creating a digital marketing pitch deck that showcases your visual funnel strategy is the most effective way to gain buy-in and support.
Structuring Your Visual Funnel Pitch Deck
A well-structured pitch deck should demonstrate your visual funnel optimization expertise while being visually compelling itself:
Pitch Deck Structure
                        flowchart TD
                            A[Problem Statement] --> B[Current Funnel Analysis]
                            B --> C[Visual Strategy Overview]
                            C --> D[Stage-by-Stage Visual Approach]
                            D --> E[Implementation Timeline]
                            E --> F[Expected Results & KPIs]
                            F --> G[Budget & Resources]
                            G --> H[Next Steps]

                            style A fill:#FF8000,stroke:#333,stroke-width:1px,color:white
                            style C fill:#FF8000,stroke:#333,stroke-width:1px,color:white
                            style D fill:#FF8000,stroke:#333,stroke-width:1px,color:white
                            style F fill:#FF8000,stroke:#333,stroke-width:1px,color:white
Visualizing ROI Projections
One of the most powerful elements of a visual funnel pitch deck is clear visualization of the expected ROI from enhanced visual content implementation:
Projected ROI from Visual Funnel Optimization
Creating Compelling Before/After Comparisons
Visual before/after comparisons of text-based vs. visual-optimized funnels are extremely effective for demonstrating the potential impact of your strategy:
These comparisons should focus on both the aesthetic improvements and the functional benefits of visual optimization, using real data whenever possible to support your case.
Using PageOn.ai for Persuasive Visual Presentations
PageOn.ai's capabilities allow me to transform complex funnel data into persuasive visual presentations that make a compelling case for visual content investment:
- Converting funnel performance data into intuitive visualizations
- Creating interactive elements that allow stakeholders to explore different scenarios
- Developing visual comparisons of current vs. optimized approaches
- Building visual roadmaps for implementation and expected results
- Creating custom visual assets that reflect the proposed strategy
Addressing Common Stakeholder Objections
When presenting your visual funnel strategy, be prepared to address these common objections with visual evidence:
| Objection | Visual Evidence to Provide |
|---|---|
| "It's too expensive" | ROI projections with timeline to break-even point |
| "Our current approach works fine" | Competitive analysis visuals showing industry benchmarks |
| "We don't have the resources" | Implementation timeline with resource allocation visualization |
| "Results are too uncertain" | Case studies with visual before/after metrics |
Future-Proofing Your Visual Conversion Funnel
As visual content continues to evolve, I believe it's essential to stay ahead of emerging trends and technologies that will reshape conversion funnel optimization in the coming years.
Emerging Visual Content Trends
Several emerging visual content trends are already beginning to reshape funnel optimization:
Augmented Reality (AR)
AR experiences allow prospects to visualize products in their own environment, dramatically reducing purchase uncertainty. I've seen conversion rate increases of 40-80% when AR is implemented at the bottom of the funnel.

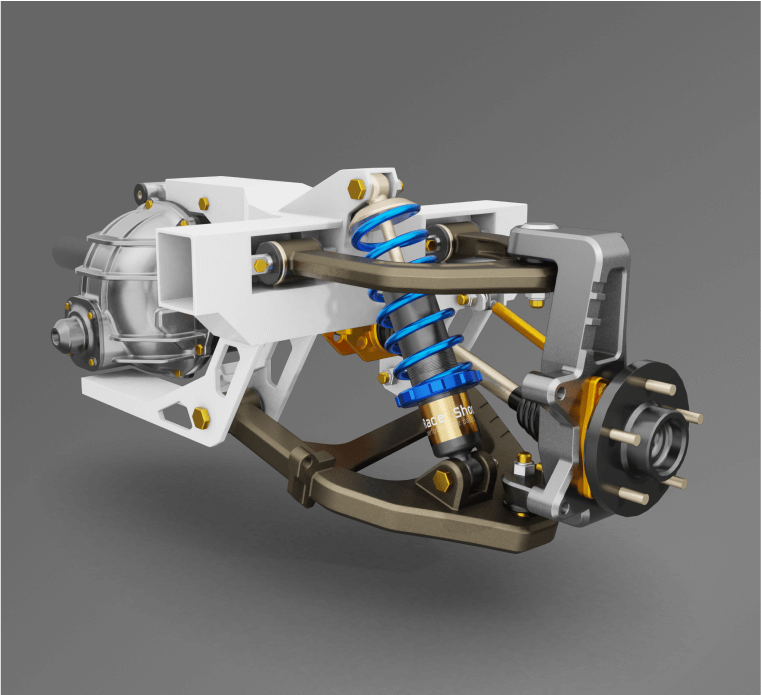
Interactive 3D
Interactive 3D content allows for deep product exploration without physical interaction. This is particularly valuable for complex products where understanding physical features is important to the purchase decision.
Virtual Reality (VR)
VR experiences create immersive product demonstrations that dramatically increase emotional connection and understanding. While still emerging as a mainstream tool, early adopters are seeing significant engagement advantages.
.webp)
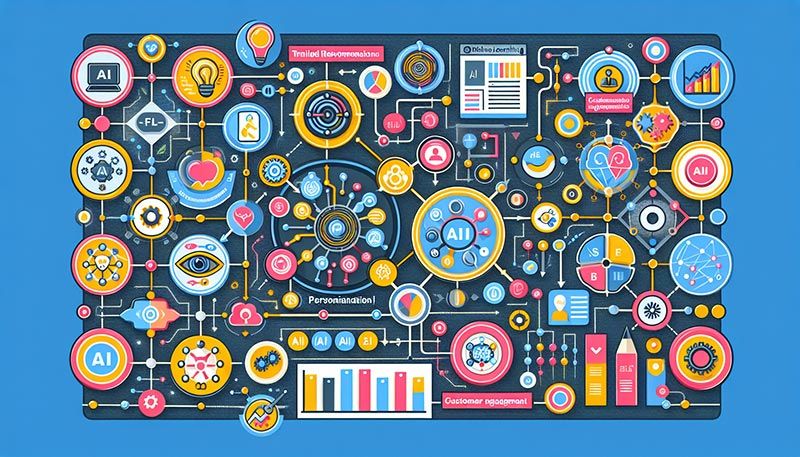
AI-Generated Personalized Visuals
AI systems that generate personalized visual content based on individual user data and behavior patterns are showing promising early results, with conversion lifts of 15-30% in initial testing.
Preparing for Visual Search Integration
Visual search is rapidly evolving and will soon become a critical component of conversion funnels. I recommend preparing for this shift with these strategies:
- Implement robust image alt text and metadata to improve visual search discoverability
- Create multiple visual angles and perspectives of products to match various search queries
- Develop visual content that answers common visual search queries in your industry
- Experiment with visual search entry points within your existing funnel
- Consider how visual search might create new entry points to your funnel
Visual Search Growth Projection
Balancing Automation and Personalization
One of the key challenges in future visual funnel optimization will be balancing automation with personalization. I recommend a strategic approach:
Automation vs. Personalization Balance
                        flowchart TD
                            A[Visual Content Strategy] --> B{Content Type}
                            B -->|High Volume/Top Funnel| C[Automated Visual Generation]
                            B -->|Targeted/Mid Funnel| D[Semi-Automated with Templates]
                            B -->|High Value/Bottom Funnel| E[Custom Visual Creation]

                            C --> F[AI-Generated Variations]
                            D --> G[Personalization Rules]
                            E --> H[Individual Customization]

                            F --> I[Performance Analysis]
                            G --> I
                            H --> I

                            I --> J[Optimization Loop]
                            J --> A

                            style A fill:#FF8000,stroke:#333,stroke-width:1px,color:white
                            style I fill:#FF8000,stroke:#333,stroke-width:1px,color:white
                            style J fill:#FF8000,stroke:#333,stroke-width:1px,color:white
This balanced approach allows for scale while maintaining the personalized touch that drives conversions, particularly at the bottom of the funnel.
Using PageOn.ai to Stay Ahead
PageOn.ai's AI capabilities provide a significant advantage in staying ahead of visual content evolution:
- Automated trend analysis to identify emerging visual content patterns
- Rapid prototyping of new visual content formats
- AI-driven personalization that scales across the entire funnel
- Continuous optimization based on performance data
- Integration with emerging technologies like AR, VR, and visual search
By leveraging these capabilities, I can help brands develop visual content roadmaps that align with both current conversion optimization goals and future technological trends, ensuring sustainable growth and competitive advantage.
Transform Your Visual Expressions with PageOn.ai
Ready to revolutionize your conversion funnel with strategic visual content? PageOn.ai's powerful visualization tools make it easy to create compelling visuals for every stage of your marketing funnel.
Start Creating with PageOn.ai TodayYou Might Also Like
The Art of Text Contrast: Transform Audience Engagement With Visual Hierarchy
Discover how strategic text contrast can guide audience attention, enhance information retention, and create more engaging content across presentations, videos, and marketing materials.
Stock Photos in Presentations: Bringing Vibrancy and Depth to Visual Storytelling
Discover how to transform your presentations with strategic stock photography. Learn selection techniques, design integration, and visual consistency to create compelling visual narratives.
Mastering Visual Flow: How Morph Transitions Transform Presentations | PageOn.ai
Discover how Morph transitions create dynamic, seamless visual connections between slides, enhancing audience engagement and transforming ordinary presentations into memorable experiences.
Beyond Bullet Points: Transform Your Text with Animated Visuals | PageOn.ai
Discover how to transform static bullet points into dynamic animated visuals that boost engagement by 40%. Learn animation fundamentals, techniques, and AI-powered solutions from PageOn.ai.