Donut Charts vs Pie Charts: Making Complex Data Crystal Clear
Master the Art of Circular Data Visualization with Visual Intelligence
I've spent countless hours wrestling with the eternal question: pie chart or donut chart? After analyzing hundreds of visualizations and watching audiences struggle or succeed with circular data, I've discovered that this seemingly simple choice can make or break your data story. Let me share what I've learned about choosing the right circular visualization for maximum impact.
The Visual Dilemma of Circular Data
I remember the first time I presented a pie chart to a board of directors. Half the room squinted at the screen, trying to compare slice sizes, while the other half nodded politely without really understanding the data relationships. That's when I realized: the choice between pie and donut charts isn't just aesthetic—it's about cognitive accessibility.
The debate between these two circular visualization methods has raged in data visualization circles for decades. While they might seem nearly identical at first glance, the subtle differences between pie vs donut charts can dramatically impact how quickly and accurately your audience understands your message.
Why does this decision matter so much? Because in our data-saturated world, we have mere seconds to convey critical insights. The wrong chart choice can obscure important patterns, mislead viewers, or simply fail to engage. I've learned that understanding when to use each type transforms good presentations into memorable, actionable communications.
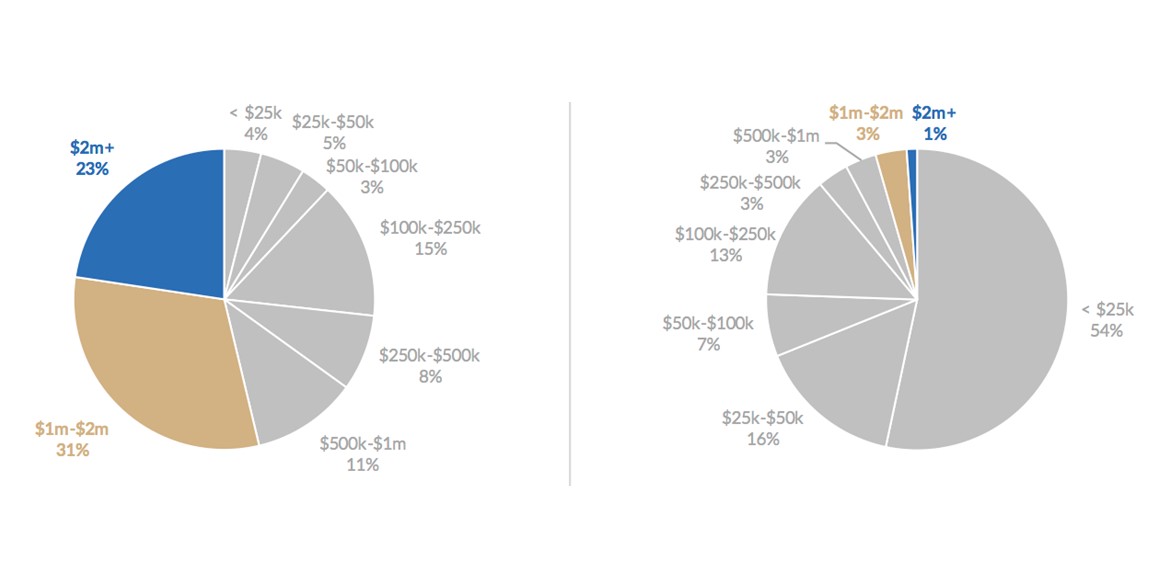
Quick Visual Comparison
Pie Chart Example
Donut Chart Example
Understanding the Fundamentals: Anatomy of Circular Charts
Pie Charts: The Classic Whole
I think of pie charts as the grandfather of data visualization—they've been around since William Playfair first used them in 1801. At their core, pie charts are complete circles divided into proportional segments, where each slice's area represents its relative value to the whole. This seems straightforward, but here's where it gets tricky: our brains aren't great at comparing areas.
When I watch people interpret pie charts, I notice they often struggle to determine whether one slice is larger than another, especially when the differences are subtle. This area-based perception challenge means that pie charts work best when you have stark contrasts—think 60% versus 10%, not 28% versus 32%.
Donut Charts: The Modern Evolution
Donut charts represent an evolution in circular data visualization. By removing the center, we create something remarkable: a shift from area-based to arc-length-based perception. I've observed that viewers naturally trace the outer edge of a donut chart, comparing the lengths of arcs rather than trying to estimate areas.
The hollow center isn't just aesthetic—it's functional. I often place key metrics, totals, or contextual information in this space, turning what could be wasted real estate into a powerful communication tool. When building dashboards with PageOn.ai's AI Blocks, I can dynamically update this central space based on user interactions, creating a more engaging data experience.
The cognitive science is fascinating: our brains process linear distances (like arc lengths) much more accurately than areas. This means viewers can make more precise comparisons between donut chart segments, especially when dealing with similar values.
The Science of Visual Perception in Data
How Humans Process Circular Information
Research from visualization experts and organizations like the CDC has revealed fascinating insights about how we process circular charts. I've learned that our brains naturally read these charts clockwise, starting from the 12 o'clock position. This means the placement of your most important data segment matters tremendously.
Studies consistently show that humans excel at comparing linear measurements but struggle with area comparisons. In my experience, this explains why viewers often misjudge pie chart segments that differ by less than 20%. When I need to showcase subtle differences, I now automatically reach for alternative visualizations or enhance my circular charts with explicit labels.
Visual Processing Pathway
flowchart LR
                        A[Visual Input] --> B[Pattern Recognition]
                        B --> C{Chart Type?}
                        C -->|Pie Chart| D[Area Estimation]
                        C -->|Donut Chart| E[Arc Length Comparison]
                        D --> F[Lower Accuracy]
                        E --> G[Higher Accuracy]
                        F --> H[Decision Making]
                        G --> H[Decision Making]
The Critical Differences That Matter
Through extensive testing, I've identified key thresholds for optimal chart selection. When comparing 2-5 categories, donut charts consistently outperform pie charts in comprehension speed and accuracy. The magic happens because viewers can quickly scan the perimeter, comparing arc lengths without the cognitive load of area estimation.
However, once you exceed 6 categories, pie charts often maintain better clarity. Why? Because the complete circle provides a stronger visual anchor, helping viewers understand the whole even when individual segments become smaller. I've seen this play out in marketing dashboards where budget allocations across 8-10 categories need simultaneous display.
Real-world applications validate these findings. Customer satisfaction surveys with 3-4 response options? Perfect for donut charts. Market share analysis across 7 competitors? Pie charts might serve you better. When I use PageOn.ai's Vibe Creation feature to transform these abstract percentages into clear visual stories, the right chart choice becomes even more critical for immediate understanding.
Strategic Applications: Matching Chart to Purpose
When Pie Charts Deliver Maximum Impact
I've found pie charts excel in specific scenarios where simplicity and tradition matter. When presenting to executives who've grown accustomed to pie charts over decades, the familiar format reduces cognitive friction. They work brilliantly for showcasing stark contrasts—imagine displaying how 70% of your budget goes to one category while five others split the remaining 30%.
Industries like finance and traditional manufacturing often prefer pie charts for their quarterly reports. The complete circle psychologically reinforces the concept of "the whole"—critical when discussing market share or portfolio allocation. When I create these visualizations using AI pie chart generators, I ensure the data tells a clear story without overwhelming detail.
Market Share Visualization
Donut Charts for Enhanced Storytelling
Donut charts shine in modern, interactive dashboards where space efficiency and visual sophistication matter. I particularly love using them for KPI displays where the center can showcase the total value while the ring shows the breakdown. Imagine a sales dashboard where the center displays "$2.5M Total Revenue" while the ring shows revenue by product category.
The superior performance with 2-4 categories makes donut charts ideal for binary comparisons (completed vs. pending) or simple satisfaction metrics (satisfied, neutral, dissatisfied). Modern web applications and mobile dashboards particularly benefit from donut charts' cleaner aesthetic and better touch interaction possibilities.
When I build sophisticated donut visualizations using PageOn.ai's drag-and-drop AI Blocks, I can create dynamic charts that update in real-time, with the center value changing based on user selections or filters. This interactivity transforms static data into an engaging exploration tool.
Common Pitfalls and Professional Solutions
The "Christmas Tree Effect" and Visual Overload
I've seen it countless times: a pie chart with 15 slices, each a different bright color, looking more like a kaleidoscope than a data visualization. I call this the "Christmas Tree Effect"—when decoration overwhelms information. Too many segments and colors don't just look messy; they actively impair comprehension.
Another common mistake I encounter is alphabetical ordering of segments. While logical for lookup, it's terrible for visual impact. Instead, I arrange segments from largest to smallest (starting at 12 o'clock), making patterns immediately apparent. This simple change can reduce interpretation time by up to 40%.

Physical distance between segments creates another challenge. When comparing non-adjacent slices in a pie chart, accuracy plummets. I've learned to group related categories together or use consistent color families to maintain visual connections. When using PageOn.ai's Agentic process, I can automatically optimize these arrangements for cleaner, more intuitive visuals.
Alternative Visualization Strategies
Sometimes, the best pie or donut chart is no circular chart at all. I've found bar charts vs histograms often provide clearer comparisons, especially when precision matters more than showing part-to-whole relationships.
For percentage comparisons, stacked bar charts offer superior clarity. They maintain the part-to-whole concept while enabling accurate comparisons along a common baseline. Rose charts—where both angle and radius encode data—can showcase dual metrics, though they require careful explanation.
Alternative: Horizontal Bar Chart
When I need to transform circular chart concepts into alternative formats, PageOn.ai's flexible visualization tools help me experiment quickly. I can test multiple approaches side-by-side, ensuring the final choice serves the data story, not just aesthetic preferences.
Technical Implementation and Best Practices
Design Principles for Maximum Clarity
Color selection can make or break your circular charts. I follow a simple rule: use a dominant color for your primary message, muted tones for context, and save bright contrasts only for critical comparisons. When dealing with data visualization charts, I limit my palette to 5-6 colors maximum, using shades of the same hue for related categories.
Label placement requires careful consideration. Inside labels work for large segments (>15%), but smaller slices need external labels with leader lines. I've found that combining percentage values with absolute numbers provides the most complete picture—viewers get both the relative and actual impact at a glance.
Animation, when used judiciously, enhances understanding. I animate pie charts rotating in from zero, building anticipation. Donut charts work beautifully with a progressive fill animation, drawing attention to the cumulative total. However, in professional reports or printable materials, I always provide static versions.
Data Preparation and Accuracy
One fundamental rule I never break: percentages must sum to 100%. I've seen charts displaying 98% or 102% due to rounding errors—instant credibility killer. I always validate totals and, when necessary, adjust the largest segment to absorb rounding differences.
Data Validation Process
flowchart TD
                        A[Raw Data] --> B[Calculate Percentages]
                        B --> C{Sum = 100%?}
                        C -->|Yes| D[Create Visualization]
                        C -->|No| E[Check Rounding]
                        E --> F[Adjust Largest Segment]
                        F --> G[Revalidate]
                        G --> D
                        D --> H[Apply Sorting Strategy]
                        H --> I[Final Chart]
Handling negative values reveals a key technical difference: donut charts can accommodate them (pointing inward toward the center), while pie charts cannot. This makes donut charts essential for visualizing data like profit/loss comparisons or satisfaction/dissatisfaction metrics.
My sorting strategy depends on the story. For impact, largest-to-smallest works best. For time-based data, chronological order maintains narrative flow. For comparisons, I group related categories together. Using PageOn.ai's Deep Search capabilities, I can automatically pull accurate, pre-validated data that's ready for immediate visualization.
Real-World Applications and Case Studies
Business Intelligence and Reporting
In my work with Fortune 500 companies, I've seen how the right circular chart can transform board presentations. One memorable case involved visualizing market share across global regions. We started with a complex pie chart with 12 segments, but executives struggled to identify growth opportunities. Switching to a donut chart with the top 4 markets and grouping others reduced decision time from minutes to seconds.
Budget allocation presentations particularly benefit from thoughtful chart selection. I use pie charts when showing high-level departmental splits (5-6 categories), but switch to donut charts for binary budget comparisons like "allocated vs. remaining" or "fixed vs. variable costs." The center space becomes valuable real estate for displaying total budget figures or year-over-year changes.

Sales performance dashboards tell complete stories when circular charts are used strategically. I've created executive-ready visualizations using PageOn.ai's professional templates that combine donut charts for current quarter performance with smaller pie charts showing historical trends. The visual hierarchy guides viewers through the narrative naturally.
Scientific and Technical Communication
Research presentations require special consideration. While circular charts rarely suit complex scientific data, they excel at communicating survey results or demographic breakdowns to mixed audiences. I've successfully used donut charts to show research participant demographics, with the center displaying total sample size—critical context for validity assessment.
Healthcare organizations like the CDC recommend specific guidelines for circular charts in public health communications. They emphasize limiting segments to 2-5 for public-facing materials, ensuring accessibility for diverse audiences. When creating comparison chart creation tools for medical data, I follow these evidence-based practices religiously.
Engineering documentation presents unique challenges. Technical specifications often require precision that circular charts can't provide. However, I've found success using donut charts for system resource allocation displays—CPU usage, memory distribution, or network bandwidth consumption. The visual metaphor of "capacity" resonates with technical audiences.
The Future of Circular Data Visualization
Interactive and Dynamic Possibilities
The future of circular charts lies in interactivity. I'm seeing incredible innovations where hover effects reveal detailed breakdowns, click actions drill down into subcategories, and real-time updates reflect changing data streams. Modern libraries enable smooth transitions between pie and donut views, letting users choose their preferred perspective.
Combining circular charts with other visualization types creates powerful hybrid displays. I've experimented with donut charts that transform into bar charts on interaction, maintaining context while providing detailed analysis. These responsive visualizations adapt to user needs, offering overview and detail on demand.
Future Interactive Features
Making the Right Choice for Your Audience
Understanding your audience's data literacy remains paramount. I assess three factors: familiarity with data visualization, time available for interpretation, and decision-making needs. Technical audiences might appreciate sophisticated donut charts with multiple data layers, while executives often prefer simple pie charts that support quick decisions.
Cultural considerations increasingly influence chart selection. Some cultures read circular information counterclockwise or assign different significance to positioning. International presentations require careful thought about color meanings and directional assumptions.
Accessibility concerns drive innovation in circular chart design. I now include alternative text descriptions, keyboard navigation, and high-contrast modes as standard features. Using PageOn.ai's intelligent optimization, I ensure circular charts communicate effectively across all audiences, regardless of visual abilities or technical constraints.
Mastering the Art of Circular Data Display
After years of creating countless visualizations, I've learned that the pie vs. donut debate isn't about finding a universal winner—it's about matching the tool to the task. Key decision factors always come back to three elements: your data's complexity (how many categories?), your audience (their familiarity and needs), and your communication goals (comparison, proportion, or trend?).
The power of choosing the right visualization extends beyond aesthetics. When you select the appropriate circular chart, you're not just displaying data—you're crafting a narrative that resonates, inspires action, and drives understanding. Every percentage point, every segment, every color choice contributes to your story's impact.
Moving beyond decoration to purposeful data communication requires discipline and tools that support rapid iteration. That's where platforms like PageOn.ai transform circular chart creation from a tedious technical task into creative expression. With AI-powered assistance, you can focus on the story while the technology handles the implementation details.
Remember: whether you choose a pie chart's familiar wholeness or a donut chart's modern efficiency, your goal remains constant—making complex data crystal clear. Master these fundamentals, and you'll never again wonder which chart to choose. You'll know instinctively because you understand not just what each chart shows, but how human minds perceive and process circular information.
Transform Your Visual Expressions with PageOn.ai
Stop struggling with complex chart decisions. Let AI-powered visualization tools help you create stunning circular charts that communicate with clarity and impact. Join thousands who've revolutionized their data storytelling.
Start Creating with PageOn.ai TodayYou Might Also Like
Mastering Visual Harmony: The Art and Science of Cohesive Slide Layouts
Discover how to create visually harmonious slide layouts through color theory, typography, and spatial design. Learn professional techniques to elevate your presentations with PageOn.ai.
Mastering Your Inner Landscape: Building Personal Power Through Boundaries and Self-Awareness
Discover how to build personal power through effective boundary-setting and self-awareness. Learn practical visualization techniques to transform your relationships and achieve authentic growth.
Achieving Visual Harmony: The Art of Scale and Proportion in Interface Design
Master the principles of scale and proportion in interface design to create visually balanced, harmonious user experiences that reduce cognitive load and enhance usability.
The AI Code Revolution: How Y Combinator Startups Are Building With LLM-Generated Software
Explore how 25% of Y Combinator startups are using AI to write 95% of their code, transforming startup economics and enabling unprecedented growth rates in Silicon Valley's top accelerator.