Transforming Design Systems: Creating Powerful Data Visualizations in Figma
Elevate your design system with dynamic data visualizations that drive decision-making
I've spent years exploring how design systems can transform data into visual stories. In this guide, I'll share how Figma has evolved into a powerful platform for data visualization and how you can leverage AI tools like PageOn.ai to create more impactful, efficient visualization systems.
The Evolution of Data Visualization in Figma
I've watched Figma evolve from a collaborative design tool to a powerful platform for creating comprehensive data visualization systems. This evolution has transformed how teams approach the visualization of complex data sets, making the process more efficient and the results more impactful.

Figma's interface has evolved to support sophisticated data visualization workflows
Measurable Impact on Design Efficiency
The data speaks for itself: Figma's data science team found that designers with access to a design system completed tasks 34% faster than those without. To put this in perspective, consider a team of seven product designers, each with 20 hours of focused design time per week. With a 34% efficiency boost from a design system, it's like adding 3.5 designers to the team every week.
The Shift to Dynamic Visualization
I've noticed a significant shift from static design elements to dynamic, data-driven visual storytelling. Modern design systems in Figma now incorporate components that can adapt to changing data inputs, allowing for more flexible and responsive visualizations.
Current Limitations
Despite these advances, designers still face challenges when creating complex data visualizations in Figma. These include:
- Limited native support for complex data binding
- Manual updates required when data changes
- Difficulty in creating truly interactive prototypes for data exploration
- Time-consuming creation of visualization variants
These limitations have created an opportunity for tools like PageOn.ai to complement Figma's capabilities and streamline the data visualization workflow, which I'll explore in more detail throughout this guide.
Building Blocks of an Effective Data Visualization System
In my experience designing visualization systems, I've found that having a comprehensive library of components is essential. Let's explore the key building blocks that make up an effective data visualization system in Figma.
                    flowchart TD
                        A[Data Visualization System] --> B[Chart Components]
                        A --> C[Color Systems]
                        A --> D[Typography Hierarchy]
                        A --> E[Layout Templates]
                        A --> F[Annotation Elements]

                        B --> B1[Basic Charts]
                        B --> B2[Complex Visualizations]
                        B --> B3[Custom Components]

                        C --> C1[Semantic Colors]
                        C --> C2[Sequential Palettes]
                        C --> C3[Divergent Palettes]

                        D --> D1[Data Labels]
                        D --> D2[Axis Formatting]
                        D --> D3[Annotations]

                        E --> E1[Dashboard Layouts]
                        E --> E2[Report Templates]
                        E --> E3[Presentation Formats]

                        F --> F1[Tooltips]
                        F --> F2[Legends]
                        F --> F3[Context Providers]

                        style A fill:#FF8000,stroke:#FF8000,color:white
                        style B fill:#FF9A3C,stroke:#FF8000
                        style C fill:#FF9A3C,stroke:#FF8000
                        style D fill:#FF9A3C,stroke:#FF8000
                        style E fill:#FF9A3C,stroke:#FF8000
                        style F fill:#FF9A3C,stroke:#FF8000
Essential Chart Types
A comprehensive data visualization charts library should include a wide range of chart types, each serving specific analytical purposes. Based on my work with design systems, here are the essential chart types to include:
| Chart Type | Best Use Cases | Design Considerations |
|---|---|---|
| Bar Charts | Comparing categories, showing distribution | Consistent spacing, clear labels, consider orientation |
| Line Charts | Trends over time, continuous data | Appropriate line weight, clear data points, thoughtful y-axis scaling |
| Pie/Donut Charts | Part-to-whole relationships (limit to 5-7 segments) | Clear color differentiation, ordered segments, consider donut for better labeling |
| Area Charts | Volume over time, cumulative values | Semi-transparent fills, clear stacking order if multiple series |
| Scatter Plots | Correlation between variables, distribution patterns | Clear data point markers, consider adding trend lines |
Color Theory for Data Visualization
Color is not just aesthetic in data visualization—it's functional. When designing data visualizations, I follow these color principles:
Sequential Palettes
For ordered data, where lighter to darker represents low to high values
Divergent Palettes
For data that diverges from a central value or neutral point
Categorical Palettes
For nominal data where colors represent distinct categories
Always consider accessibility when selecting colors. Ensure sufficient contrast and include alternative visual cues (patterns, labels) for color-blind users. I recommend testing your color palettes with tools like Stark or Color Oracle.
Typography Hierarchies
Clear typographic hierarchy is essential for guiding users through complex data visualization displays:
Chart Title (24px, Bold)
Subtitle or brief description (16px, Regular)
Axis Labels (14px, Medium)
Tick Labels (12px, Regular)
Source: Sample data (12px, Italic)
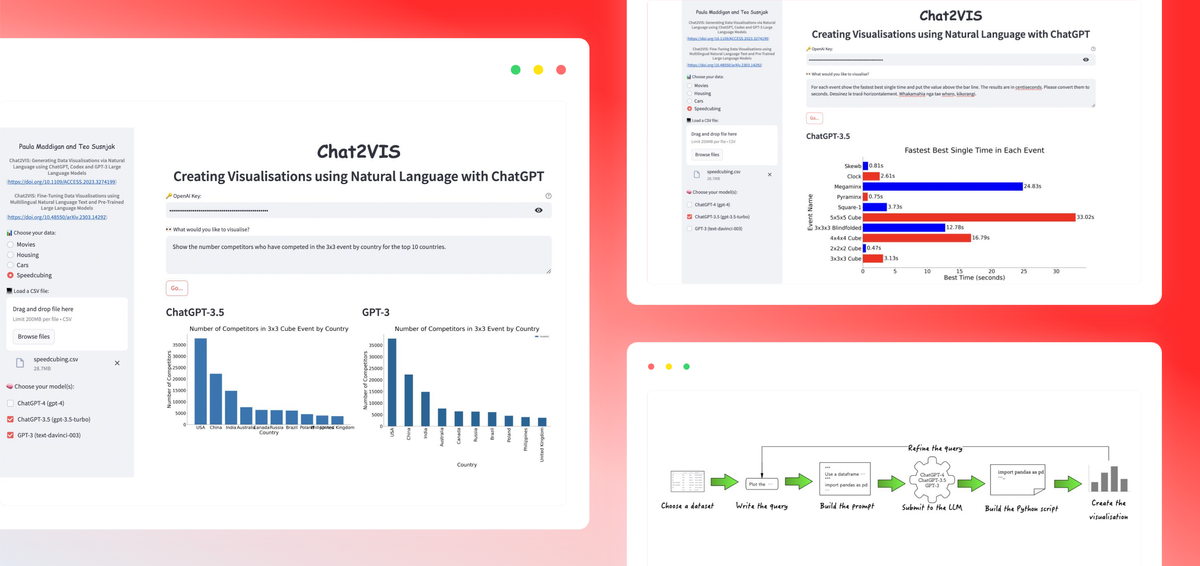
Using PageOn.ai for Rapid Prototyping
When I need to quickly prototype visualization components, I turn to PageOn.ai's AI Blocks. This tool allows me to:
- Generate multiple chart variations based on a single data set
- Quickly test different visual approaches before committing to detailed design
- Create consistent component libraries that can be exported to Figma
- Receive AI-powered suggestions for optimal chart types based on my data structure

PageOn.ai's AI Blocks feature enables rapid prototyping of visualization components
Integrating Data with Design in Figma
One of the biggest challenges I've faced when creating data visualizations in Figma is connecting real data to design components. Here, I'll share methods I've developed to bridge this gap effectively.
Methods for Connecting Data Sources
While Figma doesn't have native data connection capabilities, I've found several effective approaches to integrate real data into my visualization designs:
                    flowchart LR
                        A[Data Source] --> B{Data Processing}
                        B --> C[Plugin Integration]
                        B --> D[Variables & Styles]
                        B --> E[Component Properties]

                        C --> F[Figma Design]
                        D --> F
                        E --> F

                        style A fill:#e2e8f0,stroke:#94a3b8
                        style B fill:#FF8000,stroke:#FF8000,color:white
                        style F fill:#e2e8f0,stroke:#94a3b8
Plugin-Based Integration
Several plugins like Chart, Data Populator, and Content Reel allow you to import CSV or JSON data directly into Figma components.
Pro tip: Prepare your data with consistent formatting and structure before importing to avoid display issues.
Variables & Styles Approach
Figma's variables feature allows you to create dynamic, data-responsive designs by defining variable properties that can be updated across multiple instances.
Pro tip: Create a centralized "data layer" in your file where all variables are defined and documented.
Leveraging Figma Variables for Dynamic Designs
With the introduction of variables in Figma, I've been able to create much more dynamic data visualization components. Here's my approach:

Using Figma variables to create dynamic chart components
- Create a collection of variables for your data points (e.g., "Q1_Sales", "Q2_Sales")
- Link these variables to visual properties like height/width for bars or position for line points
- Create modes for different data scenarios (e.g., "2023_Data", "2024_Data")
- Build components that respond to these variables
Documentation Best Practices
Thorough documentation is crucial for maintaining a usable visual data presentation system. I include:
- Usage guidelines for each chart type
- Data formatting requirements
- Color usage rules and accessibility considerations
- Examples of good and bad implementations
- Component variants and their appropriate use cases
PageOn.ai's Deep Search for Data Integration
One of the most powerful features I've discovered in PageOn.ai is its Deep Search capability. This AI-powered tool can:
Find Relevant Data
Automatically locate datasets that match your visualization needs from trusted sources
Format for Integration
Clean and structure data in formats compatible with your Figma visualization components
Suggest Visualization Types
Analyze data characteristics and recommend optimal visualization approaches
Creating Responsive Visualization Components
To ensure my visualization components work across different screen sizes, I follow these principles:

Responsive visualization components adapting across different screen sizes
- Design with auto layout to enable flexible resizing
- Create variants for different screen sizes with appropriate detail levels
- Use consistent padding and spacing constraints
- Prioritize critical information that must be visible at all sizes
- Test visualizations at common breakpoints (desktop, tablet, mobile)
Advanced Visualization Techniques for Complex Data Sets
As data complexity increases, standard charts often fall short. I've developed techniques for creating more sophisticated visualizations in Figma that can handle multi-dimensional data while remaining clear and insightful.
Moving Beyond Basic Charts
For complex data stories, I often need to create custom visualization components that go beyond what's available in standard libraries:
Combination Charts
I often combine multiple chart types (e.g., bar and line) to show related but different data types together, providing more context in a single visualization.
Implementation: Create component variants that can be layered with consistent scales and axes.
Small Multiples
For comparing multiple related datasets, I create arrays of small, identical charts that allow quick visual comparison across categories or time periods.
Implementation: Build a base component and use auto-layout grids with consistent scales.
Techniques for Multi-Dimensional Data
When working with data that has many dimensions, I've developed several approaches to make it comprehensible within Figma's constraints:

Multi-dimensional data visualization using size, color, and position to encode different variables
- Use color, size, shape, and position to encode different variables
- Create interactive states that reveal additional data on hover/click (prototyped in Figma)
- Build layered visualizations that can be toggled to show different aspects of the data
- Use small multiples to break down complex relationships into comparable units
Designing for Different Audience Needs
I've learned that effective visualization systems must adapt to different audience requirements:
| Audience | Needs | Design Approach |
|---|---|---|
| Executive | High-level insights, key metrics, quick understanding | Simplified visualizations, clear headlines, minimal detail, focus on outcomes |
| Analyst | Detailed data exploration, ability to find patterns, access to raw data | More complex visualizations, interactive elements, data tables, ability to filter and sort |
| General Audience | Clear story, intuitive understanding, engaging presentation | Narrative-focused design, progressive disclosure, strong visual metaphors |
Using PageOn.ai for Complex Data Transformation
When faced with particularly complex statistical information, I use PageOn.ai to help transform it into clear visual narratives:
                    flowchart LR
                        A[Complex Data] --> B[PageOn.ai]
                        B --> C[Data Analysis]
                        B --> D[Pattern Recognition]
                        B --> E[Narrative Extraction]

                        C --> F[Visual Story]
                        D --> F
                        E --> F

                        F --> G[Figma Visualization]

                        style A fill:#e2e8f0,stroke:#94a3b8
                        style B fill:#FF8000,stroke:#FF8000,color:white
                        style G fill:#e2e8f0,stroke:#94a3b8
PageOn.ai analyzes the structure and patterns in complex datasets, then suggests the most effective visualization approaches to communicate key insights. This has been invaluable for my work with multi-dimensional data that would otherwise be difficult to represent clearly.
Case Study: Improving Decision-Making with Custom Visualization Systems
I worked with a financial services company that needed to visualize complex portfolio performance data. By creating a custom visualization system in Figma that included:
- Interactive heat maps showing risk exposure across different market sectors
- Custom small multiples for comparing performance across time periods
- Specialized components for visualizing volatility and correlation
- Variants designed for different stakeholder needs (executives vs. analysts)
The result was a 40% reduction in time spent creating reports and a significant improvement in the quality of investment decisions based on feedback from the client's team.
Optimizing Your Visualization Workflow with AI
AI tools like PageOn.ai are transforming how I approach data visualization design, making the process faster, more intuitive, and ultimately more effective.
PageOn.ai's Conversational Approach
One of the most powerful aspects of PageOn.ai is its conversational interface, which allows me to:
PageOn.ai's conversational interface for creating data visualizations
- Describe visualization needs in natural language
- Iterate quickly through multiple visualization options
- Ask for explanations about visualization best practices
- Get recommendations based on my specific data characteristics
This conversational approach dramatically reduces the learning curve for creating effective data visualizations, making it accessible even to team members without specialized data visualization expertise.
Automating Repetitive Design Tasks
I've found that AI can significantly streamline my workflow by automating many repetitive aspects of visualization design:
Tasks that PageOn.ai can automate include:
Data Formatting
Automatically clean and structure raw data for visualization
Color Palette Generation
Create accessible, harmonious color schemes based on brand guidelines
Component Variants
Generate multiple versions of charts optimized for different contexts
AI-Powered Visualization Recommendations
PageOn.ai can analyze your data and suggest the most effective visualization types based on:
- Data structure and relationships
- Number of variables and their types
- Patterns and outliers in the dataset
- The specific insights you want to highlight
- Your audience's needs and expertise level
This feature has saved me countless hours of trial and error, especially when working with unfamiliar data sets or trying to communicate complex relationships.
Converting Raw Data to Visual Stories
One of my favorite capabilities of PageOn.ai is its ability to transform raw data tables into compelling visual narratives without manual charting:
                    flowchart TD
                        A[Raw Data Table] --> B{PageOn.ai Analysis}
                        B --> C[Identify Key Insights]
                        B --> D[Select Optimal Chart Types]
                        B --> E[Generate Visual Hierarchy]

                        C --> F[Visual Story]
                        D --> F
                        E --> F

                        F --> G[Export to Figma]

                        style A fill:#e2e8f0,stroke:#94a3b8
                        style B fill:#FF8000,stroke:#FF8000,color:white
                        style F fill:#e2e8f0,stroke:#94a3b8
                        style G fill:#e2e8f0,stroke:#94a3b8
Creating Visualization Variants
When I need to explore different visualization approaches for the same dataset, PageOn.ai allows me to:

Multiple visualization variants generated from the same dataset
- Generate multiple chart types from the same dataset
- Test different visual hierarchies and emphasis points
- Create variants for different audiences (executive, analyst, general)
- Export the most effective options directly to Figma for refinement
This capability has transformed my workflow from sequential (create one chart at a time) to parallel (evaluate multiple approaches simultaneously), resulting in better final visualizations and significant time savings.
Measuring the Impact of Your Data Visualization System
Creating a beautiful visualization system isn't enough—you need to measure its effectiveness and impact. I've developed a framework for evaluating and continuously improving data visualization systems in Figma.
Utilizing Figma's Library Analytics
Figma's Library Analytics provide valuable insights into how your visualization components are being used across your organization:
Figma's Library Analytics dashboard showing component usage statistics
Key metrics to track include:
- Component adoption rates across teams
- Most frequently used visualization types
- Detach rates (indicating when components don't meet needs)
- Update acceptance rates
- Usage patterns over time
Key Effectiveness Metrics
Beyond usage statistics, I measure the effectiveness of visualization systems through:
Quantitative Metrics
- Time to create new visualizations
- Error rates in data interpretation
- Decision speed based on visualizations
- Consistency across team outputs
Qualitative Metrics
- Stakeholder comprehension
- User confidence in insights
- Perceived value of visualizations
- Ease of use for creators
Gathering and Incorporating User Feedback
Continuous improvement requires systematic feedback collection. My approach includes:
- Regular user testing sessions with both creators and consumers of visualizations
- Feedback mechanisms built into the design system documentation
- Analytics on which components require the most support or questions
- Cross-functional review sessions with data analysts, designers, and stakeholders
Integrating Analytics APIs
For enterprise teams, I recommend leveraging Figma's Library Analytics API to:
                    flowchart LR
                        A[Figma Library] --> B[Analytics API]
                        C[User Feedback] --> D[PageOn.ai]
                        E[Performance Data] --> D

                        B --> F[Integrated Dashboard]
                        D --> F

                        F --> G[Actionable Insights]
                        G --> H[System Improvements]
                        H --> A

                        style A fill:#e2e8f0,stroke:#94a3b8
                        style D fill:#FF8000,stroke:#FF8000,color:white
                        style F fill:#e2e8f0,stroke:#94a3b8
- Create custom analytics dashboards for your specific KPIs
- Track usage patterns over specific timeframes
- Integrate design system metrics with other business intelligence tools
- Set up automated alerts for potential issues (e.g., low adoption of critical components)
Using PageOn.ai for Performance Reporting
I've found PageOn.ai particularly valuable for generating visual reports on design system performance:

PageOn.ai-generated performance dashboard for visualization system metrics
PageOn.ai can connect to your analytics sources and automatically generate insightful reports that:
- Highlight key trends in system usage and effectiveness
- Identify opportunities for improvement
- Compare performance across different teams or projects
- Provide actionable recommendations based on data patterns
These automated reports save significant time and ensure that improvement efforts are data-driven rather than based on assumptions.
Future-Proofing Your Data Visualization Design System
As data visualization continues to evolve rapidly, I've developed strategies to ensure my design systems remain relevant and effective for years to come.
Emerging Trends in Data Visualization
Several key trends are shaping the future of data visualization design systems:
AI-Generated Visualizations
AI is increasingly capable of not just recommending visualization types but actually generating them based on natural language descriptions and raw data. This will dramatically lower the barrier to creating effective visualizations.
Interactive Explorations
Static visualizations are giving way to interactive visualizations for data exploration that allow users to manipulate parameters, drill down into details, and customize their view of the data.
Building Flexibility into Your System
To ensure your visualization system can adapt to evolving data needs:
Modular visualization system architecture enabling flexibility and adaptation
- Design components with modularity in mind—small, composable pieces rather than rigid templates
- Use Figma variables extensively to enable easy updates and variations
- Create clear extension points where new visualization types can be added
- Document the design principles behind components, not just how to use them
- Build in accessibility from the start rather than as an afterthought
How AI Will Transform Visualization Libraries
AI tools like PageOn.ai are fundamentally changing how visualization systems are created and maintained:
                    flowchart TD
                        A[Traditional Process] --> B[Manual Design]
                        A --> C[Manual Documentation]
                        A --> D[Manual Updates]

                        E[AI-Powered Process] --> F[AI-Generated Components]
                        E --> G[Auto-Documentation]
                        E --> H[Intelligent Updates]

                        B --> I[Design System]
                        C --> I
                        D --> I

                        F --> J[AI-Enhanced Design System]
                        G --> J
                        H --> J

                        style A fill:#e2e8f0,stroke:#94a3b8
                        style E fill:#FF8000,stroke:#FF8000,color:white
                        style I fill:#e2e8f0,stroke:#94a3b8
                        style J fill:#FF8000,stroke:#FF8000,color:white
Key transformations include:
- Automated component generation based on data characteristics and design principles
- Self-updating documentation that evolves as usage patterns change
- Intelligent adaptation of visualization components based on user behavior and feedback
- Continuous optimization of visualization effectiveness through machine learning
Preparing for Interactive and Real-Time Capabilities
While Figma currently has limitations for truly interactive data visualizations, I prepare my systems for this future by:
- Creating component states that simulate interactive behavior
- Designing with real-time data updates in mind
- Building visualization components that can gracefully handle dynamic data ranges
- Documenting interaction patterns even before they can be fully implemented
Using PageOn.ai to Stay Ahead of Trends
PageOn.ai's continuously updated knowledge base helps me stay at the forefront of visualization trends by:
PageOn.ai's trend analysis dashboard highlighting emerging visualization techniques
- Providing access to the latest research and best practices in data visualization
- Suggesting innovative approaches based on my specific data and goals
- Offering examples of cutting-edge visualization techniques from various industries
- Helping translate complex new visualization methods into practical Figma components
This ongoing learning and adaptation is essential for maintaining a visualization system that remains effective and relevant as both data needs and visualization capabilities continue to evolve.
Transform Your Visual Expressions with PageOn.ai
Ready to revolutionize how you create data visualizations in Figma? PageOn.ai helps you transform complex data into clear, compelling visual stories in minutes instead of hours. From AI-powered recommendations to seamless Figma integration, discover how our tools can elevate your data visualization design system.
Final Thoughts
Creating effective data visualization systems in Figma is a continuous journey of improvement and adaptation. By combining Figma's powerful design capabilities with AI tools like PageOn.ai, we can create visualization systems that are not only beautiful but truly effective at communicating insights and driving decisions.
I've seen firsthand how well-designed visualization systems can transform an organization's relationship with data—making complex information accessible, insights more discoverable, and decisions more confident.
As you build or refine your own data visualization design system, remember that the goal isn't just creating pretty charts—it's about enabling better understanding and more informed decisions. With the approaches outlined in this guide and tools like PageOn.ai to streamline your workflow, you're well-equipped to create visualization systems that deliver real value and stand the test of time.
You Might Also Like
Building Competitive Advantage Through Effective Speaking | Business Communication Strategy
Discover how effective speaking creates measurable competitive advantage in business. Learn strategic communication frameworks, crisis response techniques, and visualization tools for organizational success.
Transform Raw Text Data into Compelling Charts: AI-Powered Data Visualization | PageOn.ai
Discover how AI is revolutionizing data visualization by automatically creating professional charts from raw text data. Learn best practices and real-world applications with PageOn.ai.
The Art of Instant Connection: Crafting Opening Strategies That Captivate Any Audience
Discover powerful opening strategies that create instant audience connection. Learn visual storytelling, interactive techniques, and data visualization methods to captivate any audience from the start.
From Boardroom to Brilliance: Master Real Story Techniques for Corporate Speakers
Discover powerful real story techniques for corporate speakers that increase memorability by 22x. Learn authentic storytelling methods, visualization strategies, and delivery techniques for business impact.