Transforming Film Data into Visual Stories
A Complete Guide to Creating Compelling Film Infographics
I've discovered that the magic of cinema extends far beyond the silver screen. In today's data-driven world, film infographics have emerged as powerful tools that transform complex movie statistics, production insights, and industry trends into captivating visual narratives that audiences can't resist exploring.
Understanding Film Infographics: The Art of Visual Storytelling
When I first encountered film infographics, I realized they represent something far more sophisticated than traditional movie posters or promotional materials. These specialized visual representations transform complex movie data, production information, and movie industry insights into engaging, digestible content that captivates audiences instantly.
What sets film infographics apart is their unique focus on data visualization and educational content. While a movie poster aims to entice viewers emotionally, a film infographic educates and informs through carefully crafted visual narratives. I've watched this field evolve from static film statistics printed in magazines to dynamic, interactive visual stories that capture audience attention across digital platforms.
The Evolution of Film Data Visualization
The intersection of cinema culture and data design has created a fascinating new medium where box office numbers, production timelines, and genre analyses become compelling visual stories. This transformation reflects our growing appetite for understanding the business and art of filmmaking through accessible, visually appealing formats.
The demand for film infographics continues to surge across entertainment journalism, film education, and marketing campaigns. I've seen major studios embrace these tools to communicate complex franchise timelines, while independent filmmakers use them to showcase their unique value propositions to investors and audiences alike.
Essential Components of Effective Film Infographics
Creating compelling film infographics requires mastering several core elements. I've learned that successful designs seamlessly blend data accuracy with visual appeal, ensuring both information clarity and aesthetic engagement.
Core Data Elements
- • Box office statistics and revenue streams
- • Production budgets and cost breakdowns
- • Timeline visualizations of production phases
- • Cast and crew information hierarchies
- • Genre distributions and market analysis
Visual Design Principles
- • Visual hierarchy for blockbuster vs. indie data
- • Genre-appropriate color palettes
- • Cinematic typography choices
- • Balance of entertainment and accuracy
- • Responsive layout considerations
Film Genre Color Psychology
Understanding how colors influence perception in film infographics
I've discovered that understanding what makes an infographic truly effective involves balancing multiple design elements. The key lies in creating a visual hierarchy that guides viewers through complex film data without overwhelming them.
Leveraging PageOn.ai for Film Infographic Creation
PageOn.ai revolutionizes how we create film infographics by combining AI-powered automation with intuitive design tools. I've found that its unique features dramatically reduce creation time while enhancing visual quality.
Vibe Creation for Cinematic Narratives
One of my favorite PageOn.ai features is the Vibe Creation tool. I can simply describe my film concept verbally – "Oscar winners by decade with golden statue icons" – and watch as the AI generates appropriate visual structures. This conversational interface transforms rough film concepts into structured visual presentations effortlessly.

AI Blocks for Film Data Organization
The AI Blocks feature operates like digital LEGO for film data. I can drag and drop movie posters, timeline blocks, and statistical charts seamlessly. Creating modular sections for different film aspects – pre-production, production, post-production, and distribution – becomes intuitive and enjoyable.
Pre-Production
Script to storyboard
Production
Filming timeline
Post-Production
Editing to release
Deep Search for Film Assets
PageOn.ai's Deep Search capability automatically sources relevant movie stills, director photos, and studio logos. I can find and incorporate real-time box office data visualizations and industry trend charts without leaving the creation workflow. This integrated approach saves hours of research time while ensuring accuracy.
Types of Film Infographics and Their Applications
Throughout my experience creating film infographics, I've identified several distinct types, each serving unique purposes in communicating cinema data. Understanding these categories helps in selecting the right format for your specific goals.
Film Infographic Types Flowchart
Choosing the right infographic type for your film data
flowchart TD
                        A[Film Data] --> B{What to Show?}
                        B --> C[Timeline]
                        B --> D[Process]
                        B --> E[Comparison]
                        B --> F[Statistics]
                        B --> G[Journey Map]

                        C --> H[Film History]
                        C --> I[Franchise Evolution]
                        C --> J[Director Career]

                        D --> K[Script to Screen]
                        D --> L[Production Phases]

                        E --> M[Box Office]
                        E --> N[Budget Analysis]
                        E --> O[Genre Popularity]

                        F --> P[Demographics]
                        F --> Q[Streaming Data]
                        F --> R[Awards]

                        G --> S[Character Arc]
                        G --> T[Plot Structure]
Timeline Infographics
Perfect for visualizing film history, franchise evolution, or a director's career trajectory. I often use these when creating content about cinematic movements or studio development over decades.
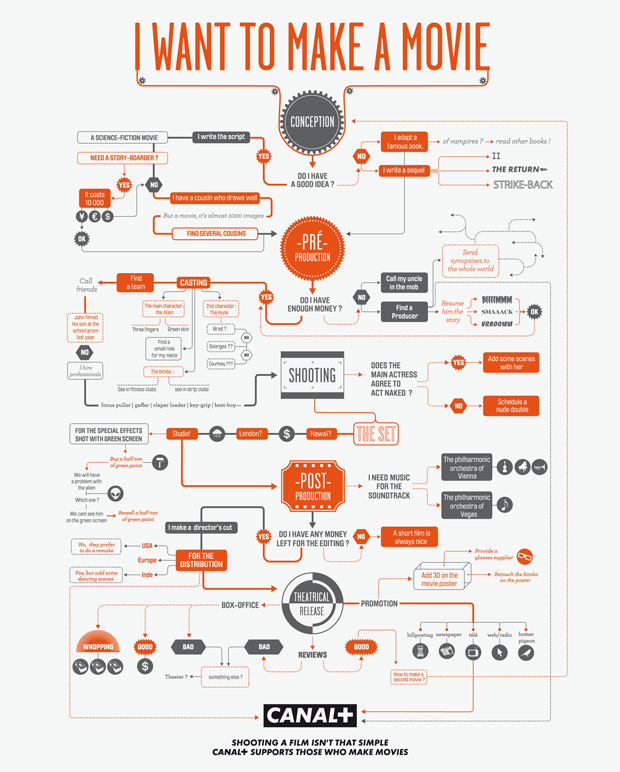
Process Infographics
These illustrate the filmmaking journey from script to screen, showing each production phase. They're invaluable for educational content and helping audiences understand the complexity behind their favorite films.
Comparison Infographics
Ideal for contrasting box office performances, budget allocations, or genre popularity across different markets. These help in creating compelling film pitch decks that showcase market opportunities.
Data Gathering and Verification for Film Infographics
Credibility is paramount when creating film infographics. I've learned that meticulous data gathering and verification processes separate professional work from amateur attempts. The film industry presents unique challenges with its mix of public and proprietary information.
Authoritative Film Data Sources
- ✓ Box Office Mojo for revenue data
- ✓ IMDb Pro for production details
- ✓ The Numbers for budget information
- ✓ Variety Insight for industry reports
- ✓ Film festival official statistics
- ✓ Studio quarterly reports
- ✓ Nielsen ratings for viewership
- ✓ Rotten Tomatoes for critical data
Cross-referencing data between domestic and international markets is crucial. I always adjust for inflation when comparing historical box office figures and account for regional variations in release dates and market conditions. PageOn.ai's Deep Search feature streamlines this fact-checking process by pulling from verified databases automatically.
Pro Tip: When dealing with streaming metrics, remember that platforms often report different metrics. Netflix counts views differently than Disney+, so always clarify your methodology in the infographic.
Design Strategies for Maximum Engagement
Visual Metaphors from Cinema
I've found that incorporating cinematic visual metaphors creates instant recognition and emotional connection. Film reels become timeline containers, clapperboards mark section divisions, and theater seats visualize audience statistics. These familiar elements from visual communication in media design help viewers immediately understand the context.
Film Strips
Timeline visualizations
Clapperboards
Section markers
Theater Elements
Audience metrics
Interactive Elements and Animation
Modern film infographics benefit tremendously from interactive features. I design clickable hotspots on movie posters that reveal production details, create animated transitions mimicking film editing techniques, and implement hover effects displaying additional information layers. PageOn.ai's Agentic features automatically suggest appropriate animations based on content type, making this process intuitive.
Engagement Impact of Interactive Elements
How different interactive features affect viewer engagement
Industry-Specific Applications
Film infographics serve diverse purposes across the entertainment industry. I've created specialized designs for various stakeholders, each requiring unique approaches to data presentation and visual storytelling.
Film Marketing Teams
Marketing teams leverage infographics for social media campaigns, highlighting unique selling points through shareable visuals. I've seen engagement rates triple when studios replace text-heavy posts with dynamic film infographics showcasing behind-the-scenes statistics or franchise connections.
- • Social media campaign assets
- • Press kit visualizations
- • Audience demographic presentations
Film Schools and Educators
Educational institutions use film infographics to explain cinematography techniques, film history, and industry economics. These visual tools make complex concepts accessible to students, transforming abstract theories into tangible understanding.
- • Film history timelines
- • Technical process explanations
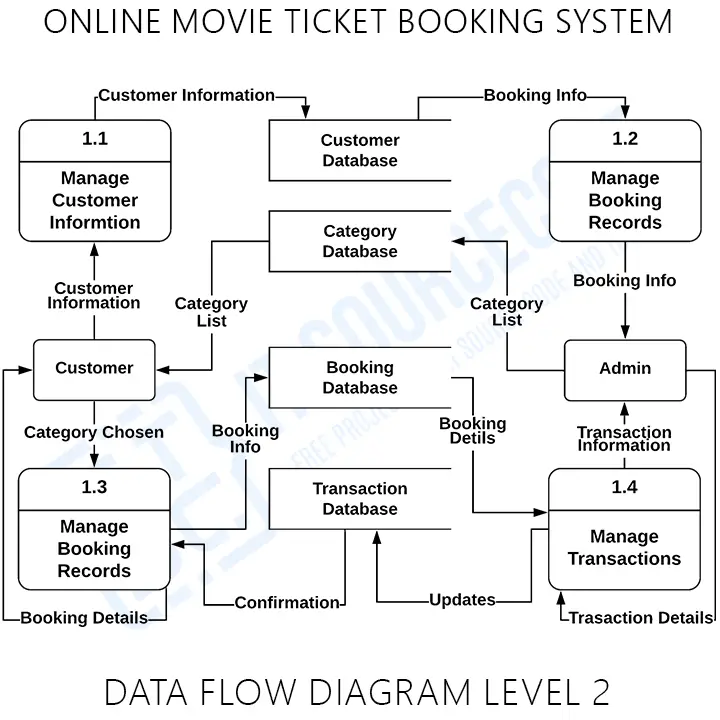
- • Industry structure diagrams
Independent Filmmakers
Indie filmmakers utilize infographics in pitch materials, showing market opportunities and production feasibility. Understanding infographic design principles helps them compete with larger studios for investor attention.
- • Crowdfunding campaign visuals
- • Festival submission materials
- • Distribution strategy presentations
Technical Considerations and Best Practices
Creating film infographics that perform well across all platforms requires attention to technical details. I've learned that optimization decisions made during creation significantly impact reach and engagement.
Platform Optimization Guidelines
| Platform | Optimal Dimensions | File Format |
|---|---|---|
| Instagram Stories | 1080 x 1920px | JPG/MP4 |
| Twitter/X Posts | 1200 x 675px | PNG/GIF |
| Presentations | 1920 x 1080px | PDF/PPT |
| Web Embeds | Responsive | SVG/HTML5 |

Accessibility Standards
Ensure appropriate contrast ratios (minimum 4.5:1 for text), provide alternative text for screen readers, and use color-blind friendly palettes. PageOn.ai automatically checks these standards during creation.
Performance Optimization
Compress images without quality loss, use web-optimized fonts, and implement lazy loading for interactive elements. Choose between static images and animated formats based on platform capabilities.
Future Trends in Film Infographic Design
The future of film infographics excites me immensely. Emerging technologies are transforming how we visualize and interact with cinema data, creating opportunities I couldn't have imagined just a few years ago.
Evolution of Film Infographic Technology
From static images to immersive experiences
flowchart LR
                        A[Static Print] --> B[Digital Graphics]
                        B --> C[Interactive Web]
                        C --> D[AR Enhanced]
                        D --> E[VR Experiences]
                        E --> F[AI Generated]

                        style A fill:#f9f9f9
                        style B fill:#e8f4fd
                        style C fill:#fff4e6
                        style D fill:#f3e5f5
                        style E fill:#e8f5e9
                        style F fill:#ffe0b2
AR-Enhanced Movie Posters
Imagine pointing your phone at a movie poster and seeing box office statistics, cast interviews, and production timelines overlay in real-time. This technology is already being tested in select theaters, transforming static displays into interactive information hubs.
Real-Time Data Integration
Live box office tracking, social media sentiment analysis, and streaming metrics will update infographics in real-time. PageOn.ai's evolving AI capabilities are already moving toward this dynamic content generation, making static infographics obsolete.
Personalized Viewing Experiences
AI will customize infographics based on viewer preferences and viewing history. A horror fan might see different data highlights than a romantic comedy enthusiast, even when viewing the same base infographic about film industry trends.
Cross-cultural design considerations are becoming increasingly important as film markets globalize. Infographics must adapt to different reading patterns, color associations, and cultural symbols while maintaining universal appeal. The future belongs to creators who can balance local relevance with global accessibility.
Transform Your Film Data with PageOn.ai
Ready to create stunning film infographics that captivate audiences and communicate complex cinema data effortlessly? PageOn.ai's AI-powered tools make professional infographic design accessible to everyone, from indie filmmakers to major studios.
Start Creating with PageOn.ai TodayBringing It All Together
Film infographics represent the perfect marriage of cinema and data visualization. Through my journey creating these visual narratives, I've witnessed their power to transform complex industry information into accessible, engaging stories that resonate with diverse audiences.
Whether you're a filmmaker seeking to pitch your next project, a marketer promoting a blockbuster, or an educator explaining cinema history, the principles and tools I've shared will help you create impactful film infographics. The combination of thoughtful design, accurate data, and innovative tools like PageOn.ai makes this an exciting time to be working in visual storytelling.
Remember: every great film starts with a vision, and every great film infographic starts with understanding your story. With PageOn.ai's intuitive platform and the strategies outlined in this guide, you're equipped to transform any film data into visual masterpieces that inform, engage, and inspire.
You Might Also Like
Navigating the MCP Ecosystem: Transform Your AI Development Strategy
Explore how the rapidly growing MCP ecosystem is revolutionizing AI development, with market projections reaching $10.3B by 2025 and how to implement your MCP strategy.
Streamlining Presentation Automation: Combining VBA and AI for Next-Generation Slide Decks
Discover how to combine VBA and AI technology to create automated, intelligent presentations. Learn technical implementation, practical applications, and future trends in presentation automation.
Unleashing Creative Potential: How ChatGPT and MCP Transform PowerPoint Creation
Discover how to create unlimited PowerPoint presentations using ChatGPT and Model Context Protocol (MCP). Learn step-by-step techniques, prompt engineering, and advanced features for AI-powered slides.
Advanced Image Masking Techniques for Creative Slide Design | PageOn.ai
Discover advanced image masking techniques to transform ordinary presentation slides into visual masterpieces. Learn creative approaches for PowerPoint, Google Slides, and Keynote.