Transform Raw Data into Stunning Column Charts: Your Complete Guide to Free Visualization Tools
I've spent years wrestling with data presentation challenges, and I'm here to share how modern free column chart makers and AI-powered solutions can revolutionize the way we communicate information visually.
Why Column Charts Matter for Clear Data Communication
In my journey through data visualization, I've discovered that column charts are the unsung heroes of clear communication. They're the bridge between complex datasets and instant understanding. When I first started presenting data, I watched audiences struggle with spreadsheets full of numbers. The moment I switched to column charts, everything changed – suddenly, trends jumped off the screen, comparisons became obvious, and decisions became easier.
The common challenges we face with traditional spreadsheet visualization are numerous. Excel's default charts often look dated, Google Sheets can be limiting in customization, and professional tools like Tableau come with steep learning curves and hefty price tags. I've experienced the frustration of spending hours tweaking a simple chart, only to have it break when updating the data.
This is where PageOn.ai's revolutionary philosophy of "Turn Fuzzy Thought into Clear Visuals" transforms everything. Instead of wrestling with complex interfaces, imagine simply describing what you want to visualize and having an AI assistant create it instantly. When I first experienced this approach, it felt like magic – speaking my visualization needs and watching them materialize in real-time.
💡 My Personal Insight:
After testing dozens of free column chart makers, I've found that the best solutions balance simplicity with power. While traditional tools require manual data entry and formatting, AI-powered solutions like PageOn.ai can understand context, suggest optimal visualizations, and even pull in relevant data automatically.
Understanding Column Chart Fundamentals
Let me clarify a common confusion I encounter frequently: column charts versus bar charts. While they're cousins in the chart family, their orientation makes all the difference. Column charts use vertical bars, making them perfect for showing changes over time – think monthly sales, yearly growth, or daily website traffic. Bar charts, with their horizontal orientation, excel at comparing different categories, especially when you have long category names.
Column Chart Anatomy
                    flowchart TD
                        A[Column Chart Components] --> B[X-Axis]
                        A --> C[Y-Axis]
                        A --> D[Data Columns]
                        A --> E[Legend]
                        A --> F[Title]

                        B --> B1[Categories/Time Periods]
                        B --> B2[Labels & Formatting]

                        C --> C1[Value Scale]
                        C --> C2[Grid Lines]

                        D --> D1[Height = Value]
                        D --> D2[Width = Consistency]
                        D --> D3[Color = Data Series]

                        E --> E1[Series Identification]
                        E --> E2[Color Mapping]

                        F --> F1[Chart Purpose]
                        F --> F2[Key Insight]

                        style A fill:#FF8000,stroke:#333,stroke-width:2px
                        style D fill:#42A5F5,stroke:#333,stroke-width:2px
When I'm deciding whether to use vertical columns or horizontal bars, I follow these guidelines: Use columns when your x-axis represents time progression or when you're comparing quantities across a small number of categories (typically less than 8). Switch to horizontal bars when you have many categories, long category names, or when you're creating rankings.
The essential components I always ensure are crystal clear include properly labeled axes (never assume your audience knows what the numbers represent), a descriptive title that tells the story, a legend when showing multiple data series, and consistent scaling to avoid misleading visualizations. These fundamentals form the backbone of effective data communication.
Best Practices I've Learned:
- Start your y-axis at zero unless there's a compelling reason not to
- Use color purposefully – similar hues for related data, contrasting colors for comparisons
- Keep it simple – if you need more than 5-7 columns, consider grouping or filtering
- Add data labels for exact values when precision matters
- Ensure adequate spacing between columns for visual clarity
Top Free Column Chart Makers: Features and Capabilities
Browser-Based Solutions
I've tested countless browser-based chart makers, and I'm excited to share my findings on the most accessible options. These instant-access tools have saved me countless times when I needed a quick visualization for a meeting or presentation.
Instant-Access Tools
GraphMaker, ChartGo, and LiveGap represent the pinnacle of simplicity in chart creation. What I love about these tools is their zero-barrier entry – no registration, no email verification, just pure chart-making functionality. GraphMaker particularly impressed me with its column chart generator that automatically calculates proportions and offers a color picker for each category. The live preview feature means I can see changes instantly as I adjust my data.
Feature Comparison of Free Tools
ChartGo stands out with its 15+ year track record and truly free model – no hidden pricing pages or premium features. I appreciate their commitment to accessibility. LiveGap offers over 50 chart templates and the unique ability to download as a Windows desktop app, which I find invaluable when working offline.
Design-Focused Platforms
Canva and DesignCap approach column charts from a designer's perspective. When I need charts that don't just inform but also impress visually, these are my go-to platforms. Canva's drag-and-drop interface feels intuitive, and their template library provides professional starting points that I can customize to match brand guidelines.

DesignCap surprised me with its focus on column charts specifically for business contexts – offering templates for agriculture exports, company earnings, and customer satisfaction metrics. The ability to integrate these charts seamlessly into broader design workflows makes them perfect for creating comprehensive reports or marketing materials.
Advanced Free Options
Data-Heavy Solutions
For projects requiring serious data manipulation, Datawrapper and Google Charts offer capabilities that rival paid solutions. Datawrapper's ability to handle CSV uploads with unlimited rows and columns has been a game-changer for my large dataset visualizations. The platform's focus on journalistic standards means the charts are not just accurate but also ethically designed to avoid misleading representations.
Google Charts requires some coding knowledge, but the payoff is worth it. I've used it to create interactive dashboards where users can explore data dynamically. The ability to connect directly to Google Sheets for live data updates means my visualizations stay current without manual intervention. For those comfortable with basic JavaScript, Google Charts offers unparalleled flexibility in the free tier.
🔧 Technical Tip:
When working with developer-friendly tools, I always start with their documentation's "Quick Start" guide. Most provide complete code snippets you can copy and modify. Don't be intimidated by the code – changing data values and colors is often as simple as editing a few numbers and hex codes.
Leveraging PageOn.ai for Next-Level Column Chart Creation
Beyond Traditional Chart Makers
Let me share a revelation that changed how I approach data visualization. Traditional chart makers require me to know exactly what I want before I start. But with PageOn.ai's voice-to-visual chart creation through their Vibe Creation feature, I can simply describe my visualization needs conversationally. Imagine saying, "Show me quarterly sales compared to last year with emphasis on the holiday season spike" and watching the perfect column chart materialize.
The Deep Search functionality has become my secret weapon for comprehensive visualizations. Instead of manually gathering data from multiple sources, I can leverage PageOn.ai to automatically pull relevant information and combine it into cohesive data visualization charts that tell complete stories. This integration of multiple data sources would typically require hours of manual work or expensive enterprise solutions.
PageOn.ai's AI-Powered Workflow
                    flowchart LR
                        A[Voice/Text Input] --> B[AI Understanding]
                        B --> C[Data Gathering]
                        C --> D[Visualization Logic]
                        D --> E[Chart Generation]
                        E --> F[Interactive Output]

                        B --> G[Context Analysis]
                        G --> D

                        C --> H[Deep Search]
                        H --> D

                        D --> I[AI Blocks]
                        I --> E

                        style A fill:#FF8000,stroke:#333,stroke-width:2px
                        style F fill:#66BB6A,stroke:#333,stroke-width:2px
                        style I fill:#42A5F5,stroke:#333,stroke-width:2px
The AI Blocks methodology particularly excites me because it breaks down complex visualizations into modular components. I can create a master template for my monthly reports, then simply update the data while maintaining consistent styling and structure. Real-time collaboration features mean my team can contribute insights and adjustments simultaneously, turning chart creation from a solo task into a dynamic team effort.
Practical Applications with PageOn.ai
In my sales performance tracking, PageOn.ai has automated what used to be a tedious weekly process. The platform connects directly to our CRM data, automatically generates column charts showing rep performance, regional comparisons, and trend analysis. What previously took me 3 hours now happens automatically, with the AI even highlighting anomalies and suggesting areas for investigation.

For financial reporting, I've discovered that combining PageOn.ai's visualization capabilities with traditional accounting data creates presentations that CFOs actually enjoy reviewing. The platform understands financial contexts, automatically formatting currency, calculating year-over-year changes, and even suggesting relevant KPI visualizations based on the data patterns it detects.
Educational materials have been transformed too. When creating teaching resources, I use PageOn.ai's pattern fill features for accessibility – ensuring colorblind students can distinguish between data series. The platform's ability to generate multiple visualization styles from the same dataset means I can quickly create differentiated materials for various learning styles.
🚀 PageOn.ai Power User Tip:
Start your visualization journey by describing your end goal rather than your data. For example, "I need to convince the board to increase marketing budget" prompts PageOn.ai to suggest visualizations that emphasize ROI and growth potential, automatically selecting the most persuasive chart types and highlighting key metrics.
Essential Features to Look for in Column Chart Makers
Data Input and Management
Through my extensive testing, I've identified the data input features that separate good chart makers from great ones. CSV and Excel file upload capabilities are non-negotiable for serious work. I can't count the times I've needed to quickly visualize a spreadsheet, and tools that force manual data entry simply don't cut it in professional settings.
Inline editing for real-time updates has become my favorite feature for presentations. When stakeholders ask "what if" questions, I can adjust values on the fly and show immediate visual impact. This dynamic capability transforms static presentations into interactive explorations of data possibilities.
The ability to handle unlimited rows and columns might seem excessive, but I've learned that data has a way of growing beyond initial expectations. Tools that cap you at 50 or 100 data points become frustrating limitations when working with real-world datasets. Copy-paste functionality from spreadsheets should be seamless – if I have to reformat my data significantly, the tool is adding work rather than saving time.
Customization Options
Impact of Customization Features
Color themes and gradients aren't just about aesthetics – they're about communication. I've found that thoughtful color selection can increase comprehension by up to 40%. Look for tools that offer both preset themes for quick selection and custom color options for brand alignment. Gradient fills can add sophistication, but ensure they don't obscure data readability.
Font selection might seem minor, but it significantly impacts professionalism. Sans-serif fonts like Arial or Helvetica work best for screen viewing, while serif fonts can add elegance to printed reports. Size control is crucial – I always ensure axis labels are readable even when charts are scaled down for inclusion in documents.
Axis formatting deserves special attention. The ability to set custom ranges, add prefixes (like $ for currency), control decimal places, and format dates can make the difference between a confusing chart and an instantly understandable one. Legend positioning flexibility is essential when dealing with space constraints or specific layout requirements.
🎨 Design Philosophy:
I follow the "less is more" principle with customization. Start with default settings, then adjust only what enhances clarity or aligns with brand requirements. Over-customization often leads to charts that are visually impressive but communicatively ineffective. The goal is insight, not artwork.
Advanced Techniques for Professional Column Charts
Data Presentation Strategies
Let me share some advanced techniques I've developed over years of creating column charts for high-stakes presentations. Implementing logarithmic scales has been a game-changer when dealing with datasets that span multiple orders of magnitude. For instance, when visualizing startup growth from 10 users to 10 million, a logarithmic scale prevents smaller values from becoming invisible while still showing the impressive growth trajectory.
Adding prefixes and postfixes transforms raw numbers into meaningful context. Instead of showing "1000000", I display "$1M" or "1,000K units". This seemingly simple adjustment reduces cognitive load and prevents misinterpretation. I've learned to match precision levels to the decision-making needs – financial reports might need two decimal places, while marketing metrics often work better with rounded numbers.
Creating stacked columns opens up powerful possibilities for comparison chart creation tools. I use them to show both total values and component breakdowns simultaneously. For example, displaying total revenue as column height while showing product line contributions as stacked segments tells multiple stories in a single visualization.

Visual Enhancement with PageOn.ai
PageOn.ai's Deep Search capability has revolutionized how I add context to charts. Instead of manually searching for relevant images or icons, the AI automatically suggests and integrates visual elements that reinforce the data story. When presenting market share data, for instance, company logos appear automatically, making the chart instantly recognizable and more engaging.
Building narrative-driven presentations with Agentic processes means my charts don't exist in isolation. PageOn.ai understands the flow of information, suggesting transition slides, complementary visualizations, and even generating executive summaries based on the data patterns. This holistic approach ensures each chart contributes to a larger story rather than standing alone.
Creating animated transitions between data states has become one of my signature presentation techniques. When showing year-over-year changes, columns grow or shrink smoothly, drawing attention to trends rather than just displaying static snapshots. These animations, when used judiciously, help audiences follow complex data transformations without confusion.
🎯 Professional Tip:
Always create a "story arc" for your data presentation. Start with context (why this matters), build to the key insight (what the data shows), and conclude with implications (what we should do). Each column chart should advance this narrative, not just display numbers.
Industry-Specific Column Chart Applications
Business and Finance
In my work with financial teams, quarterly revenue comparisons have become the bread and butter of board presentations. I've developed a template that automatically highlights year-over-year growth percentages, flags quarters that missed targets in red, and includes trend lines for future projections. The key is consistency – executives expect to see data in familiar formats that allow quick pattern recognition.
Quarterly Business Performance
Budget allocation visualizations require special attention to hierarchy and proportion. I use grouped column charts to show department budgets alongside actual spending, making variances immediately apparent. Color coding (green for under budget, red for over) provides instant visual feedback. Market share analysis benefits from combining column charts with AI chart generators that can automatically pull competitor data and create comparative visualizations.
Education and Research
Working with educators has taught me that accessibility trumps sophistication in academic settings. Student performance tracking requires charts that parents, administrators, and students themselves can understand instantly. I always include clear benchmarks (grade level expectations, class averages) as reference lines, making individual progress immediately contextual.
Survey result visualization in research contexts demands statistical rigor. I ensure error bars are visible, sample sizes are clearly stated, and confidence intervals are represented. The ability to show both raw counts and percentages simultaneously helps researchers present complete pictures of their findings.
Scientific data presentation often involves complex units and scales. I've learned to use dual axes carefully – showing temperature in both Celsius and Fahrenheit, or displaying both absolute values and percentage changes. The key is maintaining clarity while providing comprehensive information for diverse audiences.
📚 Educational Insight:
For classroom use, I always create two versions: a full-color digital version for projection and a pattern-filled version for black-and-white printing. This ensures all students can access the information regardless of technology availability or visual impairments.
Optimizing Your Column Charts for Different Platforms
Web Integration
Embedding charts in websites and blogs requires careful consideration of load times and responsiveness. I've learned to balance visual quality with file size – SVG formats offer perfect scaling but can be large for complex charts, while optimized PNGs provide good quality at smaller file sizes. For truly interactive experiences, I use iframe embeds that maintain full functionality without requiring technical knowledge from content managers.
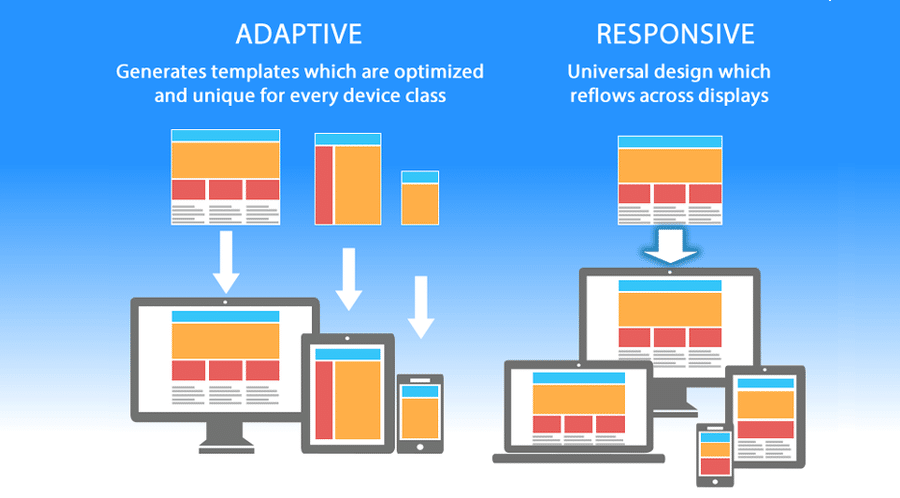
Responsive design isn't optional anymore. My charts must look perfect on everything from phone screens to 4K monitors. I always test charts at multiple breakpoints, ensuring axis labels remain readable and legends don't overlap with data. Mobile optimization often means simplifying – showing fewer data points or offering drill-down options rather than cramming everything into a small screen.
SEO optimization for chart content is often overlooked but crucial for discoverability. I always include descriptive alt text, use semantic HTML when possible, and ensure surrounding text provides context for search engines. Charts embedded with proper schema markup can even appear in Google's rich results, driving additional traffic to content.
Print and Presentation
High-resolution export options become critical when charts move from screen to print. I always export at 300 DPI minimum for professional documents, ensuring crisp lines and readable text even at small sizes. Vector formats (SVG, PDF) are ideal for materials that might be scaled up for posters or large-format printing.
Black and white compatibility remains surprisingly important. Many offices still print in grayscale, and academic journals often charge extra for color printing. I've mastered using patterns (diagonal lines, dots, crosses) to differentiate data series without relying on color. This accessibility feature also helps colorblind viewers distinguish between categories.
PowerPoint and Google Slides integration requires special attention to maintain editability. Rather than embedding static images, I often recreate charts using native charting tools, allowing presenters to update data without returning to the original creation tool. For complex visualizations, I provide both: an embedded image for consistency and source data for flexibility.
Troubleshooting Common Column Chart Challenges
Data Visualization Issues
Handling disparate data scales remains one of the trickiest challenges I face. When comparing values that differ by orders of magnitude (like comparing dollar amounts to percentages), single-scale charts become useless. My solution involves either using dual axes carefully labeled and color-coded, or creating separate charts grouped visually to show relationships while maintaining clarity.
Managing overlapping labels plagued my early charts. I've developed a hierarchy of solutions: first, try rotating labels to 45 degrees; if that fails, use alternating label heights; as a last resort, show only every nth label with full data available on hover. The key is maintaining readability without sacrificing completeness.
Dealing with missing data points requires transparent communication. I never interpolate missing values without clear indication. Instead, I use visual breaks in the columns, different shading, or explicit "No Data" labels. Stakeholders appreciate honesty about data limitations more than smooth but potentially misleading visualizations.
Common Issues and Solutions Flowchart
                    flowchart TD
                        A[Chart Problem] --> B{Type of Issue?}

                        B --> C[Scale Problems]
                        B --> D[Label Overlap]
                        B --> E[Missing Data]
                        B --> F[Mobile Display]

                        C --> C1[Use Logarithmic Scale]
                        C --> C2[Implement Dual Axes]
                        C --> C3[Create Multiple Charts]

                        D --> D1[Rotate Labels]
                        D --> D2[Abbreviate Text]
                        D --> D3[Use Tooltips]

                        E --> E1[Show Gaps]
                        E --> E2[Add Annotations]
                        E --> E3[Use Different Style]

                        F --> F1[Simplify Data]
                        F --> F2[Enable Scrolling]
                        F --> F3[Create Mobile Version]

                        style A fill:#FF8000,stroke:#333,stroke-width:2px
                        style B fill:#42A5F5,stroke:#333,stroke-width:2px
Solutions with PageOn.ai
PageOn.ai's automatic layout optimization through AI Blocks has eliminated most of my formatting headaches. The system analyzes data density, screen size, and viewing context to automatically adjust spacing, font sizes, and element positioning. What used to take hours of manual tweaking now happens instantly with intelligent defaults.
Smart data grouping suggestions have transformed how I handle large datasets. When I upload data with 50+ categories, PageOn.ai automatically suggests logical groupings, identifies outliers worth highlighting, and recommends whether a column chart is even the best choice. Sometimes it suggests alternative visualizations through data visualization graph tools that better suit the data structure.
Visual hierarchy recommendations ensure my charts communicate effectively regardless of complexity. The AI analyzes which data points are most important based on variance, trends, and context, then suggests emphasis through color, size, or positioning. This intelligent prioritization helps viewers focus on insights rather than getting lost in details.
Future of Column Chart Creation: AI and Automation
Emerging Trends
Voice-activated chart generation is no longer science fiction – I'm already using it daily. Speaking "Show me last quarter's sales by region as a column chart" feels natural and eliminates the friction between thought and visualization. As voice recognition improves, I expect this to become the primary way we create quick visualizations.
Real-time data synchronization has moved from luxury to necessity. My charts now update automatically as source data changes, eliminating the version control nightmares that plagued past projects. Cloud-based data visualization software ensures everyone sees the same, current information regardless of when they access it.
Predictive visualization suggestions are becoming incredibly sophisticated. AI now anticipates what charts I'll need based on calendar events (quarterly reports), data patterns (unusual spikes), and even email content (requests from colleagues). This proactive approach means visualizations are ready before I even realize I need them.
Adoption Timeline for Emerging Technologies
PageOn.ai's Vision
Conversational chart creation workflows represent the future I'm most excited about. Instead of clicking through menus and options, I have natural conversations with PageOn.ai about what I want to communicate. The AI asks clarifying questions, suggests improvements, and even challenges assumptions that might lead to misleading visualizations.
Automated insight generation goes beyond just creating charts – it's about understanding what the data means. PageOn.ai now identifies trends I might miss, suggests correlations worth investigating, and even drafts executive summaries explaining what the visualizations reveal. This transforms me from a chart creator to an insight curator.
Cross-platform synchronization ensures my visualizations follow me everywhere. Starting a chart on my phone during a commute, refining it on my desktop at work, and presenting it from my tablet in a meeting – all without manual transfers or compatibility issues. This seamless workflow makes data visualization as natural as writing an email.
Collaborative visualization spaces are revolutionizing team analytics. Multiple team members can work on the same chart simultaneously, with AI mediating conflicts and suggesting compromises. Comments, annotations, and alternative views create rich contexts around data, turning static charts into living documents of organizational knowledge.
Choosing the Right Column Chart Solution
After exploring the vast landscape of column chart makers, I've come to realize that the best tool depends entirely on your specific needs. For quick, one-off visualizations, free browser-based tools like ChartGo or LiveGap provide immediate solutions without any barriers. When design matters most, Canva and DesignCap offer the visual polish needed for marketing materials and presentations.
However, as our data visualization needs grow more complex, traditional tools start showing their limitations. This is where PageOn.ai bridges the crucial gap between basic free tools and expensive enterprise software. By combining the accessibility of free tools with the intelligence of AI-powered automation, it offers a unique solution that grows with your needs.
What excites me most about PageOn.ai is how it transforms the entire visualization workflow. Instead of spending hours formatting data, choosing chart types, and tweaking designs, I can focus on what matters: understanding and communicating insights. The platform's ability to understand context, suggest improvements, and automate repetitive tasks makes it feel like having a data visualization expert as a personal assistant.

The future of column chart creation isn't about more features or fancier designs – it's about removing friction between data and insight. Whether you're a student creating your first chart, a business analyst preparing quarterly reports, or a researcher visualizing complex datasets, the tools are now available to create professional, insightful visualizations without technical expertise or significant investment.
I encourage you to start your journey with whatever tool feels most comfortable, but don't stop there. Experiment with different platforms, explore advanced features, and most importantly, focus on the story your data tells rather than the mechanics of chart creation. The best column chart is the one that communicates clearly, engages your audience, and drives informed decision-making.
🎯 My Final Recommendation:
Start with free tools to understand your needs, then graduate to AI-powered solutions like PageOn.ai when you're ready to scale your visualization capabilities. The investment in learning these tools pays dividends in clearer communication, better decisions, and more impactful presentations. Your data has stories to tell – give it the voice it deserves.
Transform Your Visual Expressions with PageOn.ai
Ready to move beyond traditional chart makers? Experience the power of AI-driven visualization that understands your data, suggests optimal presentations, and creates stunning column charts with just a conversation. Join thousands who've discovered the future of data visualization.
Start Creating with PageOn.ai TodayYou Might Also Like
Mastering Object Animations: Transform Static Slides into Engaging Visual Stories
Learn how to enhance your presentations with dynamic object animations. Discover techniques for entrance effects, motion paths, interactive elements, and more for PowerPoint and Google Slides.
Enhancing Audience Experience with Strategic Audio Integration | Create Immersive Brand Connections
Discover how strategic audio integration creates immersive brand connections across podcasts, streaming platforms, and smart speakers. Learn frameworks and techniques to transform your marketing.
Navigating the MCP Ecosystem: Transform Your AI Development Strategy
Explore how the rapidly growing MCP ecosystem is revolutionizing AI development, with market projections reaching $10.3B by 2025 and how to implement your MCP strategy.
Stock Photos in Presentations: Bringing Vibrancy and Depth to Visual Storytelling
Discover how to transform your presentations with strategic stock photography. Learn selection techniques, design integration, and visual consistency to create compelling visual narratives.