Transform Your Data Into Visual Stories: The Complete Guide to Free Online Pie Chart Makers
Master the Art of Data Visualization Without Complex Software
I've spent years wrestling with complex data visualization software, only to discover that the best pie chart makers are now free, online, and incredibly powerful. Let me share my journey through the landscape of modern chart creation tools that have revolutionized how we present data in 2024.
Why Pie Charts Still Matter in 2024
I remember my first attempt at creating a pie chart back in the early 2000s. Armed with a protractor, compass, and calculator, I spent hours converting percentages to degrees and carefully drawing each slice. Today, that same chart takes me less than 30 seconds to create online, and it's interactive, animated, and perfectly proportioned.
The enduring power of pie charts lies in their immediate visual impact. When I need to show how a budget is allocated, demonstrate market share distribution, or present survey results, nothing communicates "parts of a whole" quite like a well-designed pie chart. They're the universal language of proportional data.

Common Use Cases I've Discovered
- Budget Breakdowns: Perfect for showing expense categories at a glance
- Market Share Analysis: Instantly visualize competitive landscapes
- Survey Results: Transform response percentages into compelling visuals
- Time Allocation: Demonstrate how hours are distributed across activities
- Portfolio Distribution: Show investment allocations clearly
What excites me most about modern pie chart makers is how they've eliminated every barrier to entry. No more complex software licenses, no mathematical calculations, no design skills required. We've entered an era where anyone can transform data into professional visualizations instantly.
Understanding the Landscape of Free Pie Chart Tools
After testing dozens of pie chart makers, I've categorized them into distinct types, each serving different needs and skill levels. Let me walk you through what I've discovered in my exploration of these tools.
Browser-Based Instant Tools
These are my go-to options when I need a chart in seconds:
- • ChartGo: 15+ years of reliability, no sign-up
- • Canva: Drag-and-drop with templates
- • Adobe Express: AI-powered features
Professional Design Platforms
When I need collaboration and advanced features:
- • Figma/FigJam: Real-time team collaboration
- • Graphy: Interactive charts with AI insights
- • Draxlr: SQL database integration
Tool Selection Flowchart
Here's how I decide which tool to use:
flowchart TD
                        A[Need a Pie Chart] --> B{Time Available?}
                        B -->|Less than 1 minute| C[ChartGo/PieChartMaker.co]
                        B -->|5-10 minutes| D{Design Important?}
                        D -->|Yes| E[Canva/Adobe Express]
                        D -->|Data Focus| F[Graphy/Draxlr]
                        B -->|Collaborative Project| G[Figma/FigJam]
                        C --> H[Quick Export]
                        E --> I[Beautiful Output]
                        F --> J[Data Insights]
                        G --> K[Team Creation]
The evolution from traditional tools to AI chart generators has been remarkable. I've watched as these platforms have incorporated machine learning to suggest optimal visualizations, automatically clean data, and even generate insights from patterns they detect.
What truly sets modern tools apart is their ability to handle the entire visualization workflow. When I use PageOn.ai's AI Blocks, for instance, I can structure complex data relationships visually without getting bogged down in technical details. It's this kind of intelligent assistance that's transforming how we approach data presentation.
Core Features Every Pie Chart Maker Should Have
Data Input and Management
Through my extensive testing, I've identified the data input features that separate great tools from mediocre ones. The best pie chart makers offer multiple entry methods because we all work differently.
Essential Data Features I Look For:
- ✓ Multiple input methods: Manual typing, copy-paste from Excel, CSV upload
- ✓ Real-time updates: See changes instantly as you modify data
- ✓ Automatic calculations: No manual percentage conversion needed
- ✓ Data validation: Alerts for common errors or inconsistencies
Visual Customization Options
The visual appeal of your pie chart can make or break your presentation. I've learned that customization isn't just about aesthetics—it's about clarity and communication.
Interactive Customization Example
Here's a sample of customization options in action:
One feature I particularly appreciate is the ability to choose between pie vs donut charts with a single click. This flexibility allows me to adapt my visualization based on the specific needs of my audience and the complexity of my data.
Pro Tip: Pattern Fills for Accessibility
ChartGo recently introduced pattern fills—a game-changer for black-and-white printing and colorblind accessibility. This feature, long requested by educators, ensures your charts remain distinguishable regardless of color limitations.
Professional Output Features
The true test of a pie chart maker comes at export time. I've been frustrated countless times by tools that create beautiful charts but limit how I can use them.
Image Exports
PNG, JPG, SVG formats for any use case
Embedding Options
iFrame code for websites and blogs
Interactive Features
Tooltips, animations, hover effects
When I integrate these charts with PageOn.ai's Deep Search capabilities, I can quickly find and incorporate relevant visual assets that complement my data story, creating a comprehensive visual narrative that goes beyond simple charts.
Step-by-Step Guide to Creating Effective Pie Charts
Let me walk you through my proven process for creating pie charts that not only look professional but also communicate effectively. I've refined this approach through hundreds of charts across various industries.
Start with Clean, Organized Data
The foundation of any great pie chart is well-prepared data. I always ensure my data is:
- Limited to 2-7 categories for optimal clarity
- Sorted by size (largest to smallest) for visual hierarchy
- Free of redundant or "other" categories under 5%
- Properly labeled with clear, concise descriptions
Choose the Right Starting Point
Whether I start with a template or from scratch depends on my timeline and requirements. Templates save time for standard reports, while custom charts allow for unique branding and specific data needs.
Customize for Maximum Impact
This is where your chart transforms from data to story:
- • Color Psychology: Use warm colors for positive data, cool for neutral
- • Visual Hierarchy: Explode or highlight the most important slice
- • Context Addition: Include titles, subtitles, and data sources
- • Smart Labeling: Balance between clarity and clutter
Add Final Touches
The details that separate good charts from great ones include strategic annotations, callout boxes for key insights, and subtle animations that guide the viewer's attention without overwhelming them.
Leveraging AI for Better Charts
When I use PageOn.ai's Vibe Creation feature, I can transform raw data narratives into engaging visuals that resonate with my audience. The AI understands context and suggests visual elements that enhance comprehension, turning numbers into stories that stick.
Advanced Techniques and Best Practices
When to Choose Alternative Visualizations
Through years of data visualization, I've learned that pie charts, while powerful, aren't always the answer. Knowing when to pivot to alternative visualizations is crucial for effective communication.
| Scenario | Best Chart Type | Why It Works Better |
|---|---|---|
| Precise value comparison | Bar Chart | Easier to compare exact values |
| Time-based trends | Line Chart | Shows progression and patterns |
| Hierarchical data | Treemap | Better for nested categories |
| Multiple data series | Stacked Bar | Compares parts across categories |
For complex datasets requiring multiple visualization types, I often turn to comparison chart creation tools that can present data from multiple angles simultaneously.
Collaborative Features and Team Workflows
Modern pie chart creation has become a collaborative endeavor. I've found that the best results come from teams working together, each bringing their unique perspective to the data story.
Real-Time Collaboration Benefits
- • Instant feedback on design choices
- • Multiple perspectives on data interpretation
- • Consistent branding across teams
- • Version control and change tracking
Workflow Integration Tips
- • Create reusable templates for efficiency
- • Set clear permission levels
- • Establish naming conventions
- • Document data sources consistently
Data Storytelling with Pie Charts
The most impactful pie charts I've created go beyond mere data display—they tell compelling stories that drive action. Here's how I approach narrative-driven visualization:
Data Storytelling Framework
My process for turning data into narratives:
flowchart LR
                        A[Raw Data] --> B[Find the Story]
                        B --> C[Choose Visual Style]
                        C --> D[Add Context]
                        D --> E[Create Narrative Flow]
                        E --> F[Test with Audience]
                        F --> G[Refine and Polish]
                        G --> H[Compelling Visual Story]

                        B -.-> I[Key Insight]
                        C -.-> J[Brand Alignment]
                        D -.-> K[Supporting Details]
                        E -.-> L[Logical Sequence]
By combining traditional pie charts with AI chart generators, I can now automate insight discovery while maintaining creative control over the final narrative.
Integrating these visualizations into comprehensive data visualization apps workflows has revolutionized how I present complex information to stakeholders.
Platform-Specific Strengths and Use Cases
After extensive testing of every major pie chart maker, I've developed a deep understanding of each platform's unique strengths. Let me share my insights to help you choose the perfect tool for your specific needs.
ChartGo - The Reliable Workhorse
With over 15 years of consistent service, ChartGo has become my go-to for quick, no-nonsense chart creation. What sets it apart:
- Zero sign-up friction - start creating immediately
- New pattern fill feature perfect for academic publications
- Consistently fast performance even with large datasets
- Completely free with no hidden premium features
Figma/FigJam - The Collaboration Champion
When I'm working with design teams or need real-time collaboration:
- Seamless integration with broader design workflows
- Infinite canvas for complex data presentations
- Version history and branching for experimentation
- Perfect for workshop-style data exploration
Adobe Express - The AI Pioneer
Adobe's AI integration has transformed how I approach chart design:
- AI-powered design suggestions based on data type
- Extensive template library with industry-specific options
- Seamless Creative Cloud integration
- Advanced animation capabilities for presentations
Canva - The User-Friendly Favorite
Perfect for non-designers who need professional results:
- Intuitive drag-and-drop interface
- Thousands of pre-designed templates
- Easy brand kit integration for consistency
- One-click resizing for multiple platforms
Graphy - The Data Scientist's Choice
When I need deeper data insights alongside visualization:
- AI-generated insights from data patterns
- Interactive charts with drill-down capabilities
- Direct Google Sheets integration for live data
- Advanced statistical overlays and trend analysis
Draxlr - The Business Intelligence Tool
For enterprise-level data visualization needs:
- Direct SQL database connections
- Automated report generation
- Dashboard creation capabilities
- Enterprise-grade security features
The PageOn.ai Advantage
What excites me about PageOn.ai is how it complements these tools by transforming fuzzy data concepts into clear visual narratives. While other tools focus on chart creation, PageOn.ai helps me understand what story my data should tell before I even begin designing. Its ability to turn complex information into structured visual blocks means I spend less time wrestling with layouts and more time crafting meaningful insights.
Practical Applications and Real-World Examples
Let me share how I've successfully implemented pie charts across various industries and scenarios. These real-world applications demonstrate the versatility and impact of well-crafted data visualizations.
Business and Finance
In my work with financial teams, pie charts have become indispensable for quarterly reports and investor presentations. Here's how I use them:
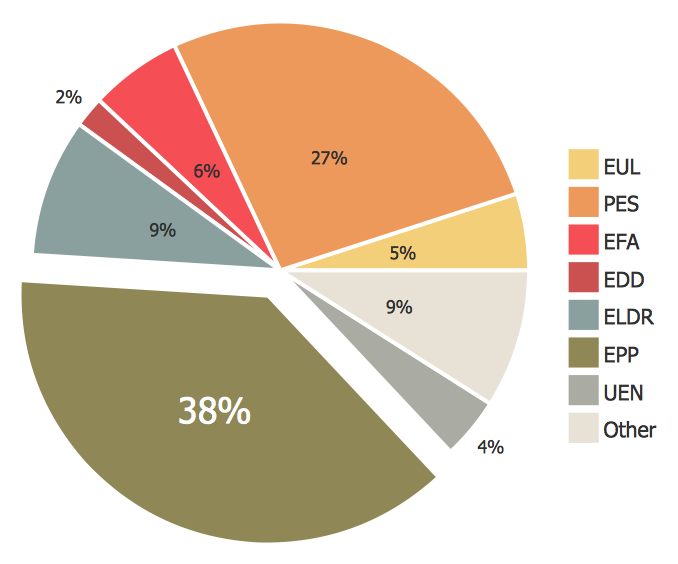
Typical Budget Allocation Visualization
A real example from a recent client project:
- Budget Allocations: Instantly show department spending proportions
- Revenue Streams: Visualize income sources at a glance
- Market Share: Compare competitive positioning clearly
- Portfolio Distribution: Display investment allocations effectively
Education and Research
Working with educational institutions has shown me the unique power of pie charts in academic settings:
Survey Result Presentations
I've helped researchers transform complex survey data into digestible insights:
- • Student satisfaction metrics
- • Research funding distribution
- • Demographic breakdowns
- • Course enrollment patterns
Performance Analytics
Educators use my charts to track and communicate:
- • Grade distributions
- • Resource utilization
- • Time allocation studies
- • Program effectiveness
Marketing and Communications
In the fast-paced world of marketing, I've learned that pie charts must be both beautiful and instantly understandable:
Campaign Performance Visualization
Social Media Engagement
Platform distribution analysis
Content Performance
Type effectiveness breakdown
Audience Demographics
Target segment visualization
Transforming Data with PageOn.ai
Using PageOn.ai's Plan, Search, Act process, I can quickly transform raw marketing data into polished visual stories. The platform's ability to understand context means I can input rough metrics and receive back structured visualizations that align with my brand's narrative goals. This has reduced my chart creation time from hours to minutes while improving the quality of insights I deliver.
Future of Pie Chart Creation and Data Visualization
As someone who's witnessed the evolution from manual chart drawing to AI-powered visualization, I'm incredibly excited about where we're heading. The future of pie chart creation is being shaped by several transformative trends.
The Rise of AI-Assisted Chart Generation
AI is revolutionizing how we approach data visualization. I'm seeing tools that not only create charts but understand the story behind the data:
Evolution of Chart Creation Technology
The transformation I've witnessed and what's coming next:
flowchart TB
                        A["Manual Drawing
Pre-2000"] --> B["Desktop Software
2000-2010"]
                        B --> C["Online Tools
2010-2020"]
                        C --> D["AI-Powered
2020-Present"]
                        D --> E["Predictive Visualization
Future"]

                        D --> F[Auto Insights]
                        D --> G[Smart Suggestions]
                        D --> H[Context Understanding]

                        E --> I[Real-time Adaptation]
                        E --> J[Audience Optimization]
                        E --> K[Narrative Generation]
Current AI Capabilities
- • Automatic insight detection
- • Optimal chart type suggestions
- • Data cleaning and preparation
- • Natural language chart creation
Emerging Technologies
- • Voice-controlled chart editing
- • AR/VR data visualization
- • Predictive trend visualization
- • Emotional response optimization
Integration with Live Data Sources
The static pie chart is becoming a thing of the past. I'm now creating visualizations that update in real-time, pulling data from multiple sources simultaneously:
Real-Time Data Integration Features
Mobile-First Design Considerations
With over 60% of my chart viewers now on mobile devices, I've had to completely rethink my approach to pie chart design:
Mobile Optimization Strategies
- Touch-friendly interactive elements with larger tap targets
- Responsive legends that adapt to screen orientation
- Progressive disclosure for complex datasets
- Gesture-based navigation for data exploration
- Optimized loading for slower mobile connections
Accessibility as a Priority
The future of pie charts must be inclusive. I'm seeing remarkable advances in accessibility features:
Screen Reader Support
Detailed descriptions and data tables for non-visual access
Colorblind Modes
Patterns and textures beyond color coding
Keyboard Navigation
Full functionality without mouse dependency
The PageOn.ai Vision: Creation is Conversation
How PageOn.ai is Shaping the Future
What truly excites me about PageOn.ai's approach is their philosophy that "Creation is Conversation." Instead of wrestling with tools, I can now have a dialogue with my data. I describe what I want to communicate, and the platform understands not just the numbers, but the narrative I'm trying to build.
This conversational approach to data visualization represents a fundamental shift. Rather than starting with a chart type and forcing data into it, PageOn.ai helps me discover the optimal visual expression for my specific story. It's like having a data visualization expert sitting beside me, offering suggestions and refining my ideas in real-time.
The platform's ability to transform fuzzy concepts into structured visual blocks means I'm no longer limited by my technical skills or design knowledge. I can focus on what matters most: the insights and actions my data should inspire.
The Convergence of Design and Analysis
I'm witnessing an exciting convergence where the boundaries between data analysis tools and design platforms are dissolving:
Platform Capability Evolution
How features are converging across platforms:
The future I envision is one where creating a pie chart is as natural as having a conversation. Where AI understands not just our data, but our intentions, our audience, and our goals. Where accessibility isn't an afterthought but a fundamental design principle.
As we move forward, the tools we use will become increasingly intelligent, but the human element—our ability to find meaning in data and craft compelling narratives—will remain irreplaceable. The best pie chart makers of the future will be those that amplify our human creativity rather than replace it.
Transform Your Visual Expressions with PageOn.ai
Ready to move beyond traditional pie charts? Discover how PageOn.ai's innovative approach to data visualization can help you create compelling visual stories that resonate with your audience. Turn complex data into clear, actionable insights with AI-powered visualization tools designed for the modern creator.
Start Creating with PageOn.ai TodayYou Might Also Like
Revolutionizing Slides: The Power of AI Presentation Tools | PageOn.ai
Discover how AI presentation tools are transforming slide creation, saving hours of work while enhancing design quality. Learn how PageOn.ai can help visualize your ideas instantly.
The Art of Text Contrast: Transform Audience Engagement With Visual Hierarchy
Discover how strategic text contrast can guide audience attention, enhance information retention, and create more engaging content across presentations, videos, and marketing materials.
Bringing Google Slides to Life with Dynamic Animations | Complete Guide
Transform static presentations into engaging visual stories with our comprehensive guide to Google Slides animations. Learn essential techniques, advanced storytelling, and practical applications.
Achieving Visual Harmony: The Art of Scale and Proportion in Interface Design
Master the principles of scale and proportion in interface design to create visually balanced, harmonious user experiences that reduce cognitive load and enhance usability.