Mapping the Legislative Journey
Transform Complex Lawmaking into Clear Visual Pathways
I've discovered that understanding how a bill becomes a law doesn't have to be overwhelming. Through interactive flowcharts and visual mapping, we can transform abstract legislative procedures into intuitive, engaging pathways that anyone can follow.
Why Legislative Process Visualization Matters
I've spent years studying the legislative process, and I've found that the biggest barrier to civic engagement isn't apathy—it's complexity. When we transform abstract procedural steps into visual pathways, suddenly the journey from idea to law becomes not just comprehensible, but fascinating.

Through my work with legal philosophy visualization, I've discovered that visual mapping clarifies common misconceptions about lawmaking. Many people believe bills follow a simple, linear path, but the reality involves multiple decision points, parallel processes, and intricate feedback loops.
Real-World Impact
Citizens, students, and professionals all benefit from clear legislative process understanding. When we use PageOn.ai's intuitive flowchart tools, we're not just creating diagrams—we're building bridges to democratic participation.
The Foundation: Core Components of Legislative Systems
Bicameral Structure Visualization
I find that understanding the parallel processes of the House and Senate becomes much clearer when we map them side-by-side. Each chamber has unique rules, procedures, and timelines that affect how legislation moves forward.
                    flowchart TB
                        subgraph "United States Congress"
                            direction TB
                            House["House of Representatives
435 Members
2-Year Terms"]
                            Senate["Senate
100 Members
6-Year Terms"]
                        end

                        House --> HC[House Committees]
                        Senate --> SC[Senate Committees]

                        HC --> HF[House Floor Action]
                        SC --> SF[Senate Floor Action]

                        HF --> Conference[Conference Committee]
                        SF --> Conference

                        Conference --> President[Presidential Action]

                        style House fill:#FF8000,stroke:#333,stroke-width:2px
                        style Senate fill:#42A5F5,stroke:#333,stroke-width:2px
                        style Conference fill:#66BB6A,stroke:#333,stroke-width:2px
                        style President fill:#AB47BC,stroke:#333,stroke-width:2px
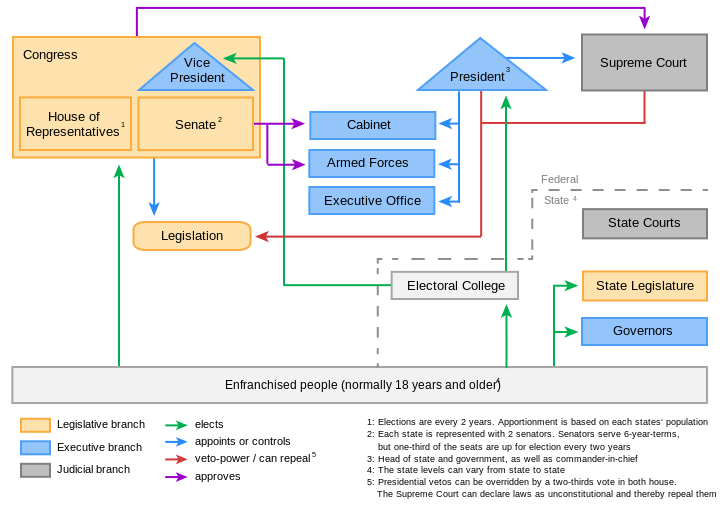
Key Players and Their Roles
The legislative ecosystem involves numerous actors beyond just legislators. I've mapped out the hierarchy and relationships between these key players to show how they influence the lawmaking process. Using PageOn.ai's AI Blocks feature, we can create interactive diagrams that reveal the complex web of interactions between legislators, committees, leadership positions, and support offices like the Congressional Budget Office (CBO) and Government Accountability Office (GAO).

Bill Introduction and Early Stages
From Idea to Introduction
Every law starts as an idea, but the pathways from concept to formal introduction vary significantly. I've identified multiple origination routes that often surprise people—bills can come from constituents, interest groups, executive agencies, or even from studying the evolution of law visualization through history.
Sources of Legislative Ideas
Committee Assignment Process
Understanding committee jurisdiction boundaries has been one of my most enlightening discoveries. Bills are referred to committees based on their subject matter, but overlapping jurisdictions can lead to multiple committee assignments. With PageOn.ai's drag-and-drop interface, I create dynamic flowcharts that show exactly how this referral process works.
| Committee Type | Jurisdiction Examples | Typical Bill Volume |
|---|---|---|
| Ways and Means | Tax legislation, Social Security | High |
| Judiciary | Constitutional amendments, Courts | Medium |
| Foreign Affairs | International relations, Treaties | Medium |
Committee Action: The Legislative Workshop
Committee Consideration Phases
I like to think of committees as legislative workshops where bills are refined, debated, and often completely transformed. The process involves multiple phases, each with distinct purposes and outcomes. Through my exploration of legal reasoning visualization, I've developed ways to map these complex committee workflows.
                    flowchart LR
                        A[Bill Referred] --> B[Subcommittee Review]
                        B --> C{Hearings}
                        C --> D[Testimony & Evidence]
                        D --> E[Mark-up Session]
                        E --> F{Committee Vote}
                        F -->|Favorable| G[Report to Floor]
                        F -->|Unfavorable| H[Bill Dies]
                        F -->|No Action| I[Bill Stalls]

                        style A fill:#FF8000,stroke:#333,stroke-width:2px
                        style G fill:#66BB6A,stroke:#333,stroke-width:2px
                        style H fill:#EF5350,stroke:#333,stroke-width:2px

Committee Decision Points
Every committee faces critical decision points that determine a bill's fate. I've created visual decision trees that illuminate these moments. When committees recommend amendments or substitutes, PageOn.ai helps me generate before/after comparisons that clearly show how the bill text evolves through the committee process.
Key Insight
Most bills never make it out of committee—understanding why requires visualizing the multiple veto points and procedural hurdles within the committee structure itself.
Floor Action and Chamber Procedures
House Floor Procedures
The House operates under structured rules that I find fascinating to visualize. The Rules Committee acts as a traffic controller, determining not just when bills come to the floor, but how they can be debated and amended. Special rules can dramatically alter a bill's trajectory.
House Calendar Distribution
Senate Floor Dynamics
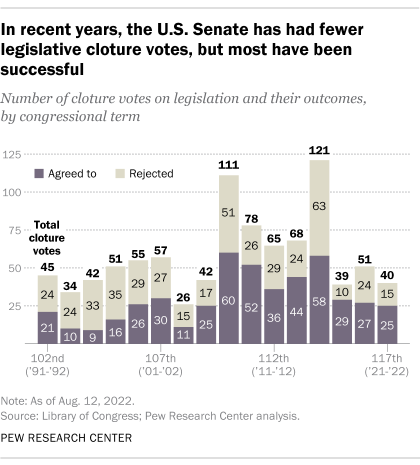
The Senate's procedures fascinate me because they're designed for deliberation over speed. I've spent considerable time mapping the filibuster process and cloture procedures. Understanding these through visual timelines reveals why the Senate moves at its distinctive pace.
Amendment Process Visualization
Creating interactive amendment trees using PageOn.ai's AI Blocks has revolutionized how I understand legislative evolution. Each amendment represents a potential fork in the road, and visualizing these branches helps track how bills transform during floor debate.
Reconciling Differences: Conference Committees
When Bills Diverge
One of the most complex aspects I've encountered is when the House and Senate pass different versions of the same bill. Conference committees become negotiation chambers where differences must be reconciled. I use side-by-side visual comparisons to show exactly where versions diverge.
                    flowchart TD
                        A[House Version] --> C[Conference Committee]
                        B[Senate Version] --> C
                        C --> D[Negotiation & Compromise]
                        D --> E[Conference Report]
                        E --> F[House Vote]
                        E --> G[Senate Vote]
                        F --> H{Both Pass?}
                        G --> H
                        H -->|Yes| I[To President]
                        H -->|No| J[Back to Conference]

                        style C fill:#FFA726,stroke:#333,stroke-width:2px
                        style I fill:#66BB6A,stroke:#333,stroke-width:2px
Through PageOn.ai's Deep Search capabilities, I've been able to find and integrate historical conference examples that illustrate how major legislation evolved through this process. The visual comparisons make it clear why some bills take months to reconcile.
Executive Action and Implementation
Presidential Decision Points
The President's role represents a critical juncture in the legislative process. I've developed timeline visualizations that show the various presidential action windows and their consequences. Understanding concepts like the pocket veto becomes much clearer when mapped visually.
Presidential Actions on Bills (Last 20 Years)
From Law to Implementation
What happens after a bill becomes law is often overlooked, but I've found it crucial to visualize. The journey from legislation to regulation involves agency rulemaking, public comment periods, and implementation timelines. My work with visual understanding medical law has shown me how complex implementation can become in specialized fields.
Special Cases and Variations
Budget and Appropriations Process
Fiscal legislation follows unique pathways that I've mapped extensively. The reconciliation process, continuing resolutions, and omnibus bills all have special procedures that bypass normal legislative rules. These exceptions are best understood through specialized flowcharts.
                    flowchart TB
                        A[President's Budget Request] --> B[Budget Resolution]
                        B --> C[Authorization Bills]
                        B --> D[Appropriations Bills]
                        C --> E[Reconciliation Process]
                        D --> F[12 Appropriations Bills]
                        F --> G[Individual Passage]
                        F --> H[Omnibus Bill]
                        G --> I[Presidential Signature]
                        H --> I
                        E --> I

                        style A fill:#AB47BC,stroke:#333,stroke-width:2px
                        style E fill:#FFA726,stroke:#333,stroke-width:2px
                        style I fill:#66BB6A,stroke:#333,stroke-width:2px
State Legislative Variations
Comparing federal and state processes reveals fascinating variations. I've studied examples from Minnesota, Texas, and Ohio, each with unique procedures. Using PageOn.ai's template system, I create comparative charts that highlight these differences, making it easier to understand how lawmaking varies across jurisdictions.

Digital Tools and Modern Tracking
Online Legislative Tracking Systems
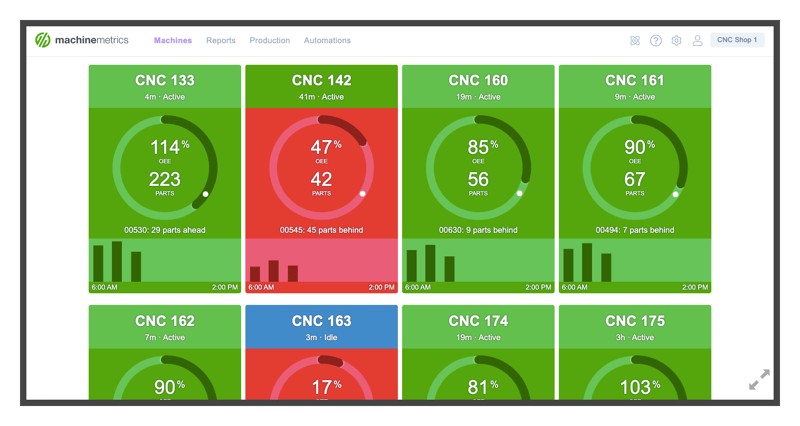
I've explored numerous digital platforms for tracking legislation, from Congress.gov to state legislature databases. Creating visual guides to navigate these systems has become essential for effective civic engagement. Real-time bill tracking dashboards transform abstract data into actionable intelligence.
Creating Your Own Process Maps
Using PageOn.ai, I build custom legislative flowcharts that integrate live data feeds. The platform's ability to combine real-time updates with visual frameworks creates dynamic tracking tools that evolve as bills progress through the system.
Sharing and collaborating on these visualizations has transformed how my team approaches visual legal reasoning and policy analysis.
Educational Applications and Best Practices
Teaching Legislative Process Visually
I've developed age-appropriate visualizations for different education levels, from elementary civics to graduate-level policy analysis. Interactive elements engage students while assessment tools using visual process maps help measure understanding in ways traditional tests cannot.
Impact of Visual Learning on Legislative Understanding
Professional Applications
Advocacy organizations use process visualization to strategize their legislative campaigns. Legal researchers map legislative history to understand statutory intent. Policy analysts employ visual frameworks to predict outcomes and identify intervention points. I've seen firsthand how PageOn.ai's intuitive tools empower these professionals to communicate complex legislative strategies clearly.
Citizen Engagement
Making democracy accessible through clear visuals isn't just an academic exercise—it's essential for civic participation. When citizens can track local legislation visually and understand exactly where their input matters most, engagement increases dramatically. We're not just creating flowcharts; we're building pathways to democratic participation.

Transform Your Visual Expressions with PageOn.ai
Ready to create stunning visualizations of complex legislative processes? PageOn.ai provides the tools you need to transform abstract procedures into clear, engaging visual narratives that anyone can understand and act upon.
You Might Also Like
Mastering Presentation Efficiency: Build Impactful Decks by Reusing Slides
Learn how to save time and create better presentations by reusing slides. Discover PowerPoint's built-in reuse features, strategic approaches, and how PageOn.ai enhances your workflow.
Mastering Image Cropping and Alignment: Creating Visual Harmony in Your Designs
Learn essential techniques for image cropping and alignment to create visually harmonious designs. Discover aspect ratios, composition strategies, and alignment principles for professional results.
Redefining Developer & Designer Roles in the Age of Intent-Based Creation | PageOn.ai
Explore how intent-based creation is transforming developer and designer collaboration, blurring traditional boundaries, and creating new hybrid roles like intent engineers in the modern tech landscape.
Smart Icon Libraries: Transform Your Document Design with Visual Intelligence
Discover how smart icon libraries can enhance your document design. Learn strategic icon selection, AI-powered systems, and visual communication techniques for better engagement and retention.