Transform Excel Bar Charts from Basic to Brilliant: A Visual Mastery Guide
Discover how I've helped thousands of professionals create compelling bar charts that turn complex data into clear, actionable insights. Master the art of visual storytelling in Excel with proven techniques and cutting-edge tools.
Why Bar Charts Matter in Today's Data Landscape

I've spent years working with data visualization, and I can tell you that the universal challenge we all face is presenting data clearly in Excel spreadsheets. When you're dealing with long category names, multiple data series, or complex comparisons, traditional column charts often fall short. That's where bar charts become your secret weapon.
Bar charts solve the readability problem elegantly by providing horizontal space for text-heavy labels. Think about it: when you're comparing sales figures across products with names like "Enterprise Cloud Storage Solution Package A" versus simply "Product A," the horizontal layout suddenly makes perfect sense.
When to Choose Bar Charts Over Column Charts
- ▶ Category names exceed 5-7 characters
- ▶ You're working with 10+ categories
- ▶ Dashboard space favors horizontal layouts
- ▶ Comparing rankings or ordered data
By integrating PageOn.ai's Deep Search capabilities, I can automatically find and incorporate relevant chart examples and best practices from across the web, ensuring my visualizations always reflect the latest trends and techniques. This AI-powered approach has transformed how I approach data visualization in Excel, making the process both faster and more insightful.
Building Your Foundation: The Anatomy of Effective Bar Charts
Understanding the core components of a bar chart is essential for creating impactful visualizations. Let me walk you through each element and show you how they work together to tell your data story.
Bar Chart Component Structure
                    flowchart LR
                        A[Raw Data] --> B[Data Organization]
                        B --> C[Categories]
                        B --> D[Values]
                        C --> E[Y-Axis Labels]
                        D --> F[X-Axis Scale]
                        E --> G[Bar Chart]
                        F --> G
                        G --> H[Title]
                        G --> I[Data Labels]
                        G --> J[Legend]
                        G --> K[Gridlines]

                        style A fill:#FF8000,stroke:#333,stroke-width:2px
                        style G fill:#42A5F5,stroke:#333,stroke-width:2px
                        style H fill:#66BB6A,stroke:#333,stroke-width:2px
                        style I fill:#66BB6A,stroke:#333,stroke-width:2px
                        style J fill:#66BB6A,stroke:#333,stroke-width:2px
                        style K fill:#66BB6A,stroke:#333,stroke-width:2px
Core Components
- Axes: Horizontal (values) and vertical (categories)
- Bars: Visual representation of data magnitude
- Labels: Category identifiers and value indicators
- Data Series: Different sets of related data
Data Arrangement Patterns
- Simple: One column of categories, one of values
- Clustered: Multiple value columns for comparison
- Stacked: Values that sum to a total
- 100% Stacked: Proportional relationships
The critical first step is always organizing your data properly. I've learned that the distinction between categories and values determines everything that follows. Using PageOn.ai's AI Blocks, I can structure my data preparation workflow visually, ensuring nothing gets missed in the process.
Step-by-Step Creation Process: From Raw Data to Visual Impact
Initial Chart Setup
My Quick-Start Process
-
1
Select your data range: Include headers for automatic labeling. I always use Ctrl+Shift+End to quickly select all relevant data.
-
2
Navigate to Insert menu: Look for the Charts group - it's your visualization command center.
-
3
Choose your bar chart type: Start with 2D clustered bar for most scenarios.
-
4
Position your chart: Click and drag to place it exactly where needed.
Essential Customization Techniques
Once I have my basic chart, the real magic happens in customization. The default Excel settings rarely tell the story effectively, so I've developed a systematic approach to transformation.
Gap Width Optimization
I reduce the default gap width from 219% to around 50-75%. This makes bars more prominent and easier to compare. Right-click any bar, select "Format Data Series," and adjust the gap width slider.
Strategic Color Selection
I follow the "less is more" principle: single color for all bars, with strategic highlights for key data points. This creates focus without overwhelming the viewer.
By leveraging PageOn.ai's Vibe Creation feature, I can brainstorm the most compelling chart narrative before even touching Excel. This ensures my bar chart in Excel tells exactly the story I want it to tell.
Advanced Formatting for Professional Results
Typography and Labeling Excellence
I've learned that typography can make or break a chart's effectiveness. The right font choices and label placement transform data from confusing to crystal clear.
Typography Hierarchy in Bar Charts
My Font Selection Guidelines
- • Primary fonts: Arial, Calibri, or Segoe UI for clarity
- • Title emphasis: Bold weight, 2-4pt larger than body
- • Data labels: Regular weight, high contrast colors
- • Axis labels: Slightly smaller, gray instead of black
Color Theory and Visual Hierarchy
Moving beyond rainbow palettes has been transformative for my charts. I now use purposeful color selection that guides the viewer's eye exactly where I want it to go.
Monochromatic
Single color, varying shades for hierarchy
Accent Highlight
Gray base with strategic color pops
Brand Aligned
Company colors for consistency
Using PageOn.ai's Agentic capabilities, I can generate context-appropriate titles and color schemes that resonate with my specific audience, ensuring my charts not only inform but also engage.
Specialized Bar Chart Applications
Comparative Analysis Charts
When I need to compare multiple data series, specialized bar chart types become invaluable. Let me show you how each type serves a unique analytical purpose.
Comparative Sales Performance
Clustered Bar Charts
Perfect for side-by-side comparisons when you need to see individual values clearly.
- ✓ Compare 2-4 data series
- ✓ Show exact values
- ✓ Identify patterns across categories
Stacked Bar Charts
Ideal for showing component relationships and totals simultaneously.
- ✓ Display part-to-whole relationships
- ✓ Compare totals across categories
- ✓ Track composition changes
Time-Series and Progress Tracking
I've discovered that horizontal bar charts excel at displaying timeline data and project progress. Here's my approach to creating Gantt-style visualizations in Excel.
Project Timeline Visualization Technique
To create timeline bars with multiple start times and durations on single bars, I use a clever stacking technique:
- 1. Create invisible "spacer" series for start positions
- 2. Stack actual duration bars on top
- 3. Format spacer bars with no fill/border
- 4. Apply distinct colors to duration bars
Visualizing these complex relationships becomes intuitive when I use PageOn.ai's structured blocks to plan out the data architecture before building the chart.
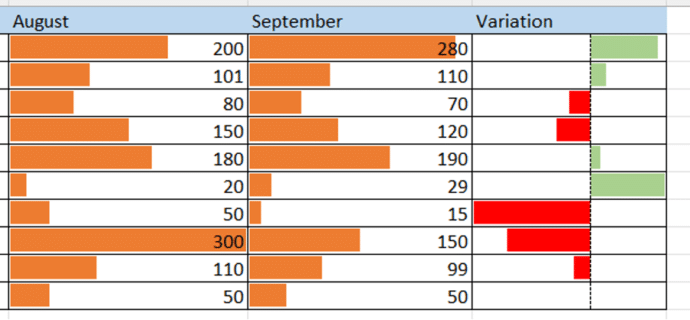
Data-Driven Storytelling Techniques
The most powerful charts I create don't just display data—they tell compelling stories. By incorporating insights from search results and adding strategic annotations, I transform static charts into narrative experiences.
The Storytelling Framework
                    flowchart TD
                        A[Raw Data] --> B[Identify Key Insights]
                        B --> C[Create Base Chart]
                        C --> D[Add Context Layer]
                        D --> E[Highlight Anomalies]
                        E --> F[Insert Callouts]
                        F --> G[Add Trend Indicators]
                        G --> H[Final Narrative]

                        B --> I[PageOn.ai Deep Search]
                        I --> J[Industry Benchmarks]
                        I --> K[Historical Context]
                        J --> D
                        K --> D

                        style A fill:#FFE5CC,stroke:#333,stroke-width:2px
                        style H fill:#FF8000,stroke:#333,stroke-width:2px
                        style I fill:#42A5F5,stroke:#333,stroke-width:2px
Context Layers
Add reference lines for industry averages or targets
Strategic Callouts
Highlight outliers with text boxes explaining significance
Trend Arrows
Show direction of change with visual indicators
Creating chart sequences that build narrative momentum is an art I've refined over time. Each chart in the sequence reveals another layer of the story, keeping viewers engaged while gradually unveiling the complete picture.
Using PageOn.ai to transform static charts into interactive visual stories has revolutionized my approach to data visualization charts. The platform's ability to automatically generate contextual insights saves me hours of research time.
Optimization and Best Practices
Performance and Efficiency
Working with large datasets doesn't have to mean compromising chart responsiveness. I've developed strategies to maintain performance while handling thousands of data points.
My Performance Optimization Checklist
Data Management
- ☑ Use dynamic named ranges for automatic updates
- ☑ Implement OFFSET functions for flexible data selection
- ☑ Create pivot tables for pre-aggregated data
- ☑ Limit visible data points to 30-50 maximum
Chart Optimization
- ☑ Disable automatic calculation during setup
- ☑ Use chart templates for consistent formatting
- ☑ Minimize use of transparency effects
- ☑ Convert to images for final presentations
Cross-Platform Considerations
Ensuring charts display correctly across Excel versions has taught me valuable lessons about compatibility and feature limitations.
| Feature | Excel 2016 | Excel 2019 | Excel 365 | Excel Web |
|---|---|---|---|---|
| Basic Bar Charts | ✓ | ✓ | ✓ | ✓ |
| Custom Error Bars | ✓ | ✓ | ✓ | ✗ |
| Recommended Charts | Limited | ✓ | ✓ | ✓ |
| Dynamic Arrays | ✗ | ✗ | ✓ | ✓ |
Streamlining the chart creation process with PageOn.ai's workflow automation has been a game-changer. I can now produce consistent, professional charts in a fraction of the time it used to take.
Common Pitfalls and How to Avoid Them

Over the years, I've seen (and made) countless charting mistakes. Let me share the most common pitfalls and how to avoid them.
❌ The 3D Trap
Problem: 3D charts distort data perception and make accurate comparisons impossible.
Solution: Stick to 2D charts. If you need visual interest, use colors and formatting instead of 3D effects.
❌ Truncated Axes
Problem: Starting the y-axis at a non-zero value exaggerates differences.
Solution: Always start at zero unless there's a compelling reason not to, and clearly indicate any axis breaks.
❌ Cluttered Legends
Problem: Including legends for single-series charts wastes space and adds confusion.
Solution: Only use legends when you have multiple data series. For single series, use the chart title.
❌ Aesthetic Over Accuracy
Problem: Prioritizing visual appeal over data integrity leads to misleading charts.
Solution: Balance design with accuracy. Always test if your chart communicates the right message.
Using PageOn.ai's Deep Search, I can find examples of chart mistakes to avoid, learning from others' experiences to continuously improve my visualization skills. Understanding bar charts vs histograms and when to use each is just one example of the nuanced decisions that separate good charts from great ones.
Integration with Modern Workflows
Static Excel charts are just the beginning. I've integrated my bar charts into dynamic, automated workflows that save hours of manual work each week.
Modern Chart Workflow Architecture
                    flowchart LR
                        A[Live Data Sources] --> B[Excel Power Query]
                        B --> C[Pivot Tables]
                        C --> D[Dynamic Charts]
                        D --> E[Automated Reports]

                        A --> F[SQL Database]
                        A --> G[Web APIs]
                        A --> H[CSV Files]

                        E --> I[Email Distribution]
                        E --> J[SharePoint]
                        E --> K[Power BI]

                        D --> L[PageOn.ai]
                        L --> M[Enhanced Visuals]
                        M --> E

                        style A fill:#FFE5CC,stroke:#333,stroke-width:2px
                        style D fill:#FF8000,stroke:#333,stroke-width:2px
                        style L fill:#42A5F5,stroke:#333,stroke-width:2px
                        style M fill:#66BB6A,stroke:#333,stroke-width:2px
Live Data Connections
I connect Excel charts directly to live data sources using Power Query, ensuring my visualizations always reflect current information.
- • Automatic refresh schedules
- • Error handling for missing data
- • Data transformation rules
Pivot Table Integration
Creating charts from pivot tables provides dynamic analysis capabilities that static charts can't match.
- • Drill-down functionality
- • Slicer controls for filtering
- • Automatic aggregation updates
Building interactive dashboards with multiple chart types has become my specialty. By combining bar charts with other visualizations, I create comprehensive analytical tools that tell complete stories.
Dashboard Design Principles
- 1. Visual Hierarchy: Most important metrics at top-left
- 2. Consistent Styling: Unified color scheme across all charts
- 3. Interactive Elements: Slicers and filters for user control
- 4. Performance Balance: Limit to 6-8 charts per dashboard
- 5. Mobile Responsiveness: Test on different screen sizes
Future-Proofing Your Visualization Skills

The landscape of data visualization is evolving rapidly. I'm constantly adapting my skills to stay ahead of emerging trends and technologies.
Evolution of Visualization Technologies
Current State
Static charts with manual updates and limited interactivity
Emerging Now
AI-assisted creation with automated insights and recommendations
Future Vision
Immersive 3D visualizations with real-time collaboration
Moving beyond static charts to interactive visualizations is no longer optional—it's essential. I'm leveraging AI tools like PageOn.ai to accelerate chart creation and enhance visual storytelling in ways that weren't possible just a few years ago.
Skills for Tomorrow's Data Visualization
- ✨ AI-powered chart generation
- ✨ Natural language data queries
- ✨ Automated insight discovery
- ✨ Real-time collaboration features
- ✨ Cross-platform visualization
- ✨ Responsive design principles
- ✨ Accessibility standards
- ✨ Performance optimization
The future of data visualization is bright, and tools like PageOn.ai are making it more accessible than ever. By combining traditional Excel skills with modern AI capabilities, we can create visualizations that not only inform but truly inspire action.
Transform Your Visual Expressions with PageOn.ai
Ready to take your data visualization to the next level? PageOn.ai combines the power of AI with intuitive design tools to help you create stunning visual stories that captivate your audience. From automated chart generation to intelligent insight discovery, experience the future of data visualization today.
Start Creating with PageOn.ai TodayYour Journey to Bar Chart Mastery
We've covered everything from basic bar chart creation to advanced formatting techniques and future-ready skills. The journey from Excel novice to visualization expert is one I've traveled myself, and I can assure you that mastering these techniques will transform how you communicate with data.
Remember, creating effective bar charts isn't just about technical skills—it's about understanding your audience, choosing the right visualization for your data, and telling compelling stories that drive action. Whether you're presenting quarterly results, comparing product performance, or tracking project timelines, the principles we've explored will serve you well.
As you continue developing your visualization skills, consider how tools like PageOn.ai can amplify your capabilities. The combination of Excel's robust functionality with AI-powered enhancement creates possibilities we're only beginning to explore.
Key Takeaways
- 📊 Choose bar charts when category names are long or numerous
- 🎨 Use purposeful color schemes, not rainbow palettes
- 📐 Always start axes at zero unless clearly indicated otherwise
- 💡 Add context through annotations and reference lines
- 🚀 Embrace AI tools to accelerate and enhance your workflow
- 🔄 Keep learning and adapting as visualization technology evolves
The world needs more people who can transform complex data into clear, actionable insights. With the techniques and tools we've discussed, you're well-equipped to join that elite group. Start practicing today, experiment with different approaches, and most importantly, never stop learning. Your data has stories to tell—now you have the skills to help it speak.
You Might Also Like
Engaging Your Audience: Crafting Interactive and Visually Captivating Slides
Discover how to transform static presentations into interactive visual experiences that captivate audiences through strategic design, interactive elements, and data visualization techniques.
The Ultimate Design Tools & Workflow Ecosystem for Creative Professionals
Discover essential design tools and optimized workflows for creative professionals. Learn how to build a cohesive ecosystem of visual tools that streamline ideation, feedback, and asset management.
Mastering Animation Timing: Essential Techniques for Dynamic Presentation Slides
Learn essential animation timing techniques for creating dynamic presentation slides. Master entrance, exit, and transition timing for PowerPoint and Google Slides to enhance your visual storytelling.
Creating Dynamic LLM Comparison Presentations with Model Context Protocol | Visual Guide
Learn how to build effective LLM comparison presentations using Model Context Protocol. Explore visualization techniques, decision frameworks, and implementation roadmaps with PageOn.ai.