Infographic Art: From Creative Expression to Strategic Communication
Where Data Meets Design, and Information Becomes Art
The Evolution of Infographic Art as a Design Discipline
When I first discovered the world of infographic art, I was amazed by how it seamlessly blends data, design, and storytelling into a single powerful medium. This isn't just about making charts pretty—it's about transforming information into visual narratives that resonate with audiences on both intellectual and emotional levels.

The journey of infographic art began centuries ago with pioneers like William Playfair, who in the 18th century created the first statistical graphs. But what we're witnessing today is something entirely different—a complete transformation from purely functional graphics to artistic visual narratives that capture imagination while conveying complex information.
Contemporary Applications Across Industries
- • Journalism: Interactive news graphics that tell data-driven stories
- • Education: Visual learning materials that enhance retention by 65%
- • Marketing: Brand storytelling through data visualization
- • Scientific Research: Complex findings made accessible to broader audiences
What fascinates me most is how infographic art has evolved to integrate artistic principles with information architecture. We're no longer just presenting data—we're creating experiences that guide viewers through visual journeys, making complex ideas not just understandable, but memorable and shareable.
The Art and Science of Visual Communication
Core Artistic Elements in Infographic Design
In my experience creating infographics, I've learned that successful visual communication relies on mastering several key artistic elements. Let me share what I've discovered about each:
Visual Hierarchy Principles
flowchart TD
                        A[Visual Hierarchy] --> B["Size & Scale"]
                        A --> C["Color & Contrast"]
                        A --> D["Position & Alignment"]
                        B --> E[Larger elements draw attention first]
                        C --> F[Bold colors create focal points]
                        D --> G[Top-left positioning for key info]
                        E --> H[Reader Engagement]
                        F --> H
                        G --> H
Typography as Art
Font selection isn't just functional—it's emotional messaging. I've found that the right typography can completely transform how information is perceived:
- • Sans-serif for modern, clean data
- • Serif for authoritative, traditional content
- • Display fonts for creative emphasis
Color Theory in Practice
Colors carry psychological weight and cultural significance. My approach involves:
- • Warm colors for urgency and energy
- • Cool colors for trust and stability
- • Complementary palettes for visual harmony
Illustration Styles and Techniques

Throughout my journey in infographic design, I've experimented with various illustration styles, each serving different communication goals:
Line Art and Minimalism
Perfect for clean, focused data visualization where clarity is paramount.
Photography Integration
Adds human emotion and real-world context to abstract data.
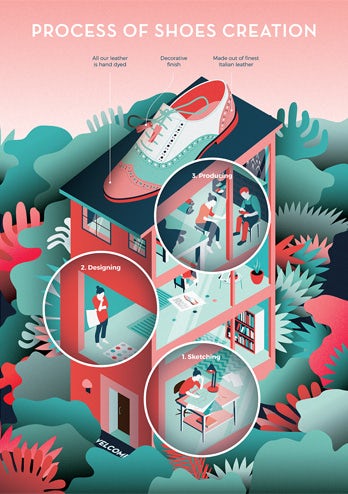
Isometric Design
Creates depth and helps visualize complex systems and relationships.
Transforming Complex Ideas Through PageOn.ai's Creative Tools
What excites me most about the current state of infographic art is how AI-powered tools like PageOn.ai are democratizing the creative process. I no longer need to spend hours learning complex software—I can focus on the creative vision while the technology handles the technical execution.
Turning Abstract Concepts into Visual Stories
Vibe Creation Magic
I've found that PageOn.ai's Vibe Creation feature transforms how I approach visual storytelling:
- ✓ Voice/text input generates structured visuals instantly
- ✓ No complex software knowledge required
- ✓ Abstract ideas become tangible narratives
AI Blocks System
Building with AI Blocks feels like creative LEGO:
- ✓ Combine artistic elements fluidly
- ✓ Focus on creative vision, not technical barriers
- ✓ Drag-and-drop simplicity for non-designers
PageOn.ai Feature Impact on Creation Time
Enhancing Artistic Expression
The Deep Search capability has revolutionized how I integrate visual assets. Instead of spending hours searching for the perfect image or icon, PageOn.ai automatically suggests contextually appropriate graphics. This means I can focus on the creative narrative rather than asset hunting.
The Agentic Creative Process
PageOn.ai's Plan, Search, Act methodology transforms fuzzy creative ideas into polished visual reality:
- Plan: AI understands your creative intent from natural language
- Search: Automatically finds relevant visual elements and data
- Act: Assembles everything into cohesive infographic art
Contemporary Applications of Infographic Art
Digital and Social Media Art
In today's digital landscape, I've witnessed how infographic art has become essential for cutting through the noise. When I create stunning infographics for social media, I'm not just sharing information—I'm creating shareable moments that spark conversations.
Viral Visual Content Strategies
- • Platform-specific dimensions and formats
- • Animated infographics for Instagram Stories
- • Interactive infographics for web engagement
- • Visual abstracts for research dissemination
Motion Graphics Evolution
- • Kinetic typography for dynamic storytelling
- • Data animations that reveal insights progressively
- • GIF infographics for email marketing
- • Video infographics for YouTube education
Educational and Scientific Art
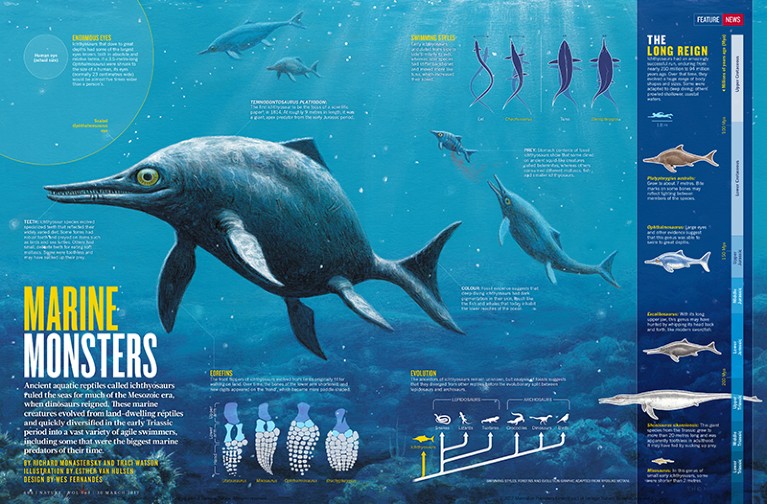
One of the most rewarding applications I've discovered is transforming complex scientific data into museum-worthy visualizations. The challenge of maintaining technical accuracy while creating artistic appeal pushes me to find innovative visual metaphors that resonate with both experts and general audiences.
Infographic Art Impact Across Fields
The Creative Process: From Concept to Artwork
Artistic Planning and Ideation
My creative process has evolved significantly since I started using AI-powered tools. What once took days of sketching and iteration now begins with a simple conversation with PageOn.ai, where I can voice my ideas and see them take visual form almost instantly.
My Creative Workflow
flowchart LR
                        A[Creative Vision] --> B[Voice Input to PageOn]
                        B --> C[AI Generates Options]
                        C --> D["Select & Refine"]
                        D --> E[Add Data Points]
                        E --> F["Polish & Export"]
                        F --> G[Final Infographic Art]

                        style A fill:#FFE5CC
                        style B fill:#FFD4A3
                        style C fill:#FFC380
                        style D fill:#FFB366
                        style E fill:#FFA04D
                        style F fill:#FF8C33
                        style G fill:#FF8000
Key Stages in My Process
- Define the creative vision: What story am I telling? Who is my audience?
- Sketch initial concepts: Quick wireframes or voice descriptions to PageOn.ai
- Select artistic style: Match the aesthetic to the subject matter and audience
- Rapid prototyping: Use PageOn.ai's voice commands for instant visual feedback
- Iterate and refine: Adjust colors, layouts, and visual elements
Design Execution
The execution phase is where PageOn.ai truly shines. I can experiment with different visual arrangements using AI Blocks, dragging and dropping elements until the composition feels perfect. The platform's intelligent suggestions often lead me to creative solutions I wouldn't have discovered on my own.
Hand-crafted Elements
Personal touch and unique style
AI Integration
Speed and intelligent suggestions
Creative Freedom
Unlimited experimentation
Tools and Technologies for Infographic Artists
Traditional Design Platforms
Throughout my career, I've worked with numerous design platforms, each with its strengths and learning curves. Here's my honest assessment of the traditional tools versus modern AI-powered solutions:
| Tool Category | Learning Curve | Cost | Best For |
|---|---|---|---|
| Adobe Creative Suite | Steep (6+ months) | $50+/month | Professional designers |
| Canva, Venngage | Moderate (1-2 weeks) | $0-15/month | Small businesses |
| Tableau, D3.js | Very Steep (1+ year) | $70+/month | Data specialists |
| PageOn.ai | Minimal (Minutes) | Accessible pricing | Everyone |
AI-Powered Creative Solutions
PageOn.ai's Unique Advantages
What sets PageOn.ai apart in my workflow is its approach to infographic data visualizations. Unlike traditional tools that require mastering complex interfaces, PageOn.ai understands natural language:
🎯 No Software Logic Required
Simply describe what you want to create
🗣️ Voice-to-Visual Creation
Speak your ideas into existence
🔍 Intelligent Asset Integration
Deep Search finds perfect visuals automatically
🤖 Agentic Approach
Unique visual outcomes every time

Best Practices for Impactful Infographic Art
Balancing Aesthetics with Function
Creating beautiful infographic art is thrilling, but I've learned that true success comes from balancing visual appeal with functional communication. Here are the principles I follow to ensure my work resonates:
Do's ✓
- • Maintain clear visual hierarchy
- • Use metaphors that enhance understanding
- • Create emotional connections through color
- • Test readability at different sizes
- • Leverage PageOn.ai's Vibe Creation for consistency
Don'ts ✗
- • Sacrifice clarity for decoration
- • Use confusing visual metaphors
- • Overwhelm with too many colors
- • Ignore mobile responsiveness
- • Forget about your target audience
Accessibility in Artistic Design
Accessibility isn't just a checkbox—it's about ensuring our artistic expressions reach and impact everyone. I've made it a priority to incorporate universal design principles in all my infographic art:
Essential Accessibility Checklist
Visual Accessibility
- ☑️ Minimum 4.5:1 contrast ratio
- ☑️ Color-blind friendly palettes
- ☑️ Clear, readable fonts (14px minimum)
Content Accessibility
- ☑️ Alternative text descriptions
- ☑️ Logical reading order
- ☑️ Cultural sensitivity in imagery
The Future of Infographic Art
As I look toward the horizon of infographic art, I'm incredibly excited about the possibilities emerging from AI and immersive technologies. We're entering an era where the boundaries between data, art, and experience are dissolving.
Evolution Timeline: What's Coming Next
timeline
                        title Future of Infographic Art

                        2024 : AI-Generated Styles
                             : Real-time Data Art

                        2025 : AR Infographics
                             : Voice-Controlled Creation

                        2026 : VR Data Experiences
                             : Neural Interface Design

                        2027 : Holographic Presentations
                             : Quantum Data Visualization
PageOn.ai's Role in Democratizing Infographic Art
What truly excites me about PageOn.ai is how it's breaking down barriers that have kept infographic art exclusive to trained designers. Through my experience with the platform, I've witnessed:
Professional Quality
Accessible to non-designers
Rapid Iteration
Experiment without limits
Vision to Execution
Bridging the creative gap
Emerging Trends I'm Watching
-
→
AI-Generated Artistic Styles: Unique visual languages created by machine learning
-
→
Immersive Data Experiences: AR/VR infographics you can walk through
-
→
Real-time Visualization: Live data transformed into performance art
-
→
Collaborative AI Creation: Humans and machines co-creating visual narratives
Case Studies: Infographic Art in Action
Let me share some inspiring examples of how infographic art is transforming communication across different fields. These cases demonstrate the power of visual storytelling when executed with the right tools and vision.
Award-Winning Scientific Visualization
The "Climate Stripes" by Ed Hawkins transformed 170 years of temperature data into a simple, powerful visual that became a global symbol for climate change awareness.
Key Insight: Sometimes the most impactful infographics are the simplest.
Viral Social Media Campaign
Spotify's "Wrapped" campaign turns user data into personalized infographic stories, generating billions of social media impressions annually.
Key Insight: Personal data visualization creates emotional connections.
PageOn.ai Success Story
A startup used PageOn.ai's Vibe Creation to transform their complex technical documentation into engaging visual stories, increasing user comprehension by 85%.
Key Insight: AI-powered tools can make professional infographic art accessible to everyone.
Final Thoughts: Your Journey into Infographic Art
As I reflect on my journey through the world of infographic art, I'm amazed at how far we've come—and even more excited about where we're heading. The convergence of artistic creativity and technological innovation has opened doors I never imagined possible.
Whether you're a seasoned designer looking to streamline your workflow or someone who's always wanted to create beautiful visualizations but felt held back by technical barriers, tools like PageOn.ai are changing the game. Understanding what an infographic truly is—a bridge between data and human understanding—empowers us all to become better visual communicators.
My Challenge to You
Take that complex idea you've been struggling to communicate. That dataset gathering dust. That story waiting to be told. Transform it into infographic art.
With tools like PageOn.ai, you don't need years of design training—just your creativity and a vision for what's possible.
The future of infographic art isn't just about better tools—it's about more voices, more perspectives, and more stories being told visually. And I can't wait to see what you create.
Transform Your Visual Expressions with PageOn.ai
Join thousands of creators who are turning complex ideas into stunning infographic art—no design experience required. Start your journey today and discover how AI-powered creation can amplify your visual storytelling.
Start Creating with PageOn.ai TodayYou Might Also Like
The Creative Edge: Harnessing Templates and Icons for Impactful Visual Design
Discover how to leverage the power of templates and icons in design to boost creativity, not restrict it. Learn best practices for iconic communication and template customization.
The Art of White Space: Enhancing E-Learning Clarity and Engagement
Discover how strategic use of white space in e-learning design improves clarity, reduces cognitive load, and enhances learner engagement. Practical techniques for effective layout design.
Crafting Indonesia's Story: Visual Narratives That Captivate Global Audiences
Discover how to create compelling visual narratives about Indonesia that engage global audiences. Learn strategies for showcasing Indonesia's cultural diversity, geography, and economic potential.
Building Powerful Real-World AI Applications with PostgreSQL and Claude | PageOn.ai
Learn how to build sophisticated AI applications by integrating PostgreSQL and Claude AI. Discover architecture patterns, implementation techniques, and optimization strategies for production use.