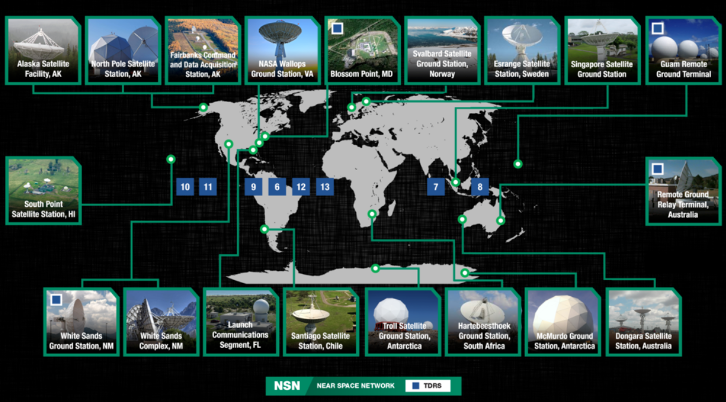
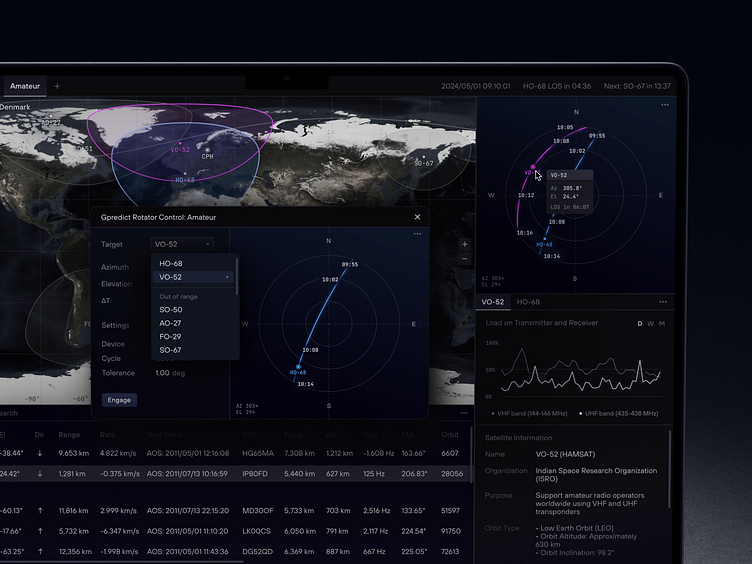
Mastering AI Space Infographics: From Complex Data to Clear Visual Intelligence
Transform the $35 Billion AI Space Revolution into Compelling Visual Stories
As we witness the explosive growth of AI in space exploration—from today's $3 billion market to a projected $35 billion by 2033—I've discovered that the biggest challenge isn't the technology itself, but how we communicate its complexity. Let me share my journey of transforming dense technical data into visual intelligence that actually drives understanding and decision-making.
The AI Space Revolution: Why Visual Clarity Matters Now
When I first encountered the staggering statistics of AI in space exploration, I was overwhelmed. We're talking about a market exploding from $2-3 billion today to $35 billion by 2033—a 32.4% CAGR that's reshaping everything we know about space operations. With over 5,500 operational satellites currently orbiting Earth and 58,000 more expected by 2030, the sheer scale of data and complexity is mind-boggling.

The challenge I've faced—and I'm sure you have too—is that traditional technical documentation simply fails to capture the interconnected nature of AI systems in space operations. Government agencies controlling 73% of the market share, commercial entities racing to innovate, and academic institutions pushing boundaries all need different visual approaches to understand and communicate these complex systems.
The Information Overload Challenge
Space agencies and commercial companies struggle daily with communicating their AI implementations effectively. I've discovered that leveraging tools like PageOn.ai's Vibe Creation can transform dense technical specifications into accessible visual narratives that actually resonate with diverse stakeholder groups.
Market Share Distribution by Stakeholder
Mapping the AI Space Ecosystem: Core Technologies and Applications
My exploration of the AI space ecosystem revealed five fundamental pillars that are transforming how we operate beyond Earth's atmosphere. Machine Learning dominates with a 62.38% market share, powering everything from autonomous navigation to predictive maintenance systems that can forecast equipment failures before they happen.
Five Pillars of Space AI Technology
graph TD
                        A[AI Space Technologies] --> B["Machine Learning
62.38% Market Share"]
                        A --> C["Computer Vision
95% Vessel Detection"]
                        A --> D["Natural Language Processing
Mission Communication"]
                        A --> E["Robotics
30% Task Automation"]
                        A --> F["Data Analytics
Telemetry Processing"]

                        B --> B1[Autonomous Navigation]
                        B --> B2[Predictive Maintenance]

                        C --> C1[Satellite Imagery]
                        C --> C2[Object Detection]

                        D --> D1[Mission Control]
                        D --> D2[Report Generation]

                        E --> E1[Spacewalk Assistance]
                        E --> E2[Sample Collection]

                        F --> F1[Anomaly Detection]
                        F --> F2[Performance Optimization]

                        style A fill:#FF8000,stroke:#333,stroke-width:3px,color:#fff
                        style B fill:#42A5F5,stroke:#333,stroke-width:2px,color:#fff
                        style C fill:#66BB6A,stroke:#333,stroke-width:2px,color:#fff
                        style D fill:#AB47BC,stroke:#333,stroke-width:2px,color:#fff
                        style E fill:#FFA726,stroke:#333,stroke-width:2px,color:#fff
                        style F fill:#EF5350,stroke:#333,stroke-width:2px,color:#fff
What truly excites me is how Computer Vision has achieved 95% accuracy in vessel detection from satellite imagery, while Natural Language Processing is revolutionizing mission control communication systems. Robotics is automating 30% of astronaut tasks, and Data Analytics processes vast telemetry streams from multiple missions simultaneously.
Mission-Critical Applications
- • Autonomous spacecraft health monitoring
- • Real-time anomaly detection
- • Mission planning optimization
- • Deep space navigation
- • Asteroid mining prospecting
Visualization Opportunity
I've found that creating application workflow diagrams with AI diagrams helps stakeholders instantly grasp complex interconnections. PageOn.ai's drag-and-drop interface makes this process intuitive, even for non-technical team members.

Building Your AI Space Infographic: Data Architecture and Flow
The data foundation layer presents one of our biggest challenges. I've worked with both structured and unstructured space data, and the complexity is staggering. ESA's approach to creating a common data layer architecture has been particularly enlightening—they're tackling data governance strategies that enable multi-mission integration while maintaining security and efficiency.
ESA's A²I Roadmap Structure
The European Space Agency has identified 14 specific use cases across 5 priority domains, creating a comprehensive framework for AI implementation. Their timeline visualization shows progression from current Technology Readiness Levels to 2025 completion targets.
Phase 1: Foundation
Data architecture and governance establishment
Phase 2: Integration
Cross-development synergies and scalability
Phase 3: Deployment
Operational AI systems across missions
Regional Market Dynamics (2024-2033)
North America's dominance with 40% market share and $0.8 billion in 2023 revenue showcases the region's commitment to AI-driven space exploration. I've learned that visualizing these regional dynamics helps stakeholders understand global investment patterns and identify emerging opportunities. Using AI compute visual guides, we can effectively communicate the computational requirements driving these regional differences.

Success Stories: AI Transforming Space Operations
The real-world deployments of AI in space operations have exceeded my expectations. ESA's AInabler platform, implementing MLOps principles for space applications, represents a paradigm shift in how we approach AI deployment beyond Earth. OCAI (Operations CompAnIon) has already enhanced decision-making for over 10 missions, demonstrating tangible benefits that were once purely theoretical.
Operational AI Deployments
ESA's AInabler
MLOps platform for scalable AI deployment
OCAI System
Enhanced operations for 10+ missions
NASA Mars Rover AI
90% accurate Martian surface mapping
SpaceX Autonomous Systems
Self-landing rockets and docking
Measurable Impact Metrics
- Efficiency Improvement: 10-15%
- Asteroid Detection Accuracy: +10%
- AI Adoption Growth (5 years): 29,300%
- Cost Reduction: Significant
AI Impact on Space Operations Timeline
timeline
                        title Evolution of AI in Space Operations

                        2019 : Initial AI Experiments
                             : Basic automation
                             : Limited scope

                        2021 : ESA A²I Roadmap
                             : 14 use cases identified
                             : Industry collaboration

                        2023 : Operational Deployments
                             : AInabler platform
                             : OCAI for 10+ missions
                             : 4caster forecasting

                        2024 : Market Acceleration
                             : $3B market value
                             : 5,500 satellites
                             : 95% detection accuracy

                        2025 : Roadmap Completion
                             : Full AI integration
                             : Autonomous missions

                        2033 : Future Vision
                             : $35B market
                             : 58,000 new satellites
                             : Deep space autonomy
I'm particularly impressed by the ESA Anomaly Dataset, released in June 2024, which provides the first large-scale, real-life satellite telemetry dataset with curated anomaly annotations. This open approach to data sharing accelerates innovation across the entire industry. When creating AI presentation summaries of these achievements, the visual impact helps stakeholders immediately grasp the transformative potential.

Key Players and Market Forces: The Competitive Landscape
The competitive landscape in AI space exploration fascinates me with its blend of established giants and nimble innovators. Government agencies like NASA and ESA maintain their leadership through massive funding and decades of expertise, while commercial players like SpaceX and Blue Origin push boundaries with aggressive innovation cycles.
Investment Distribution Across Sectors
Major Investment Milestones
Booz Allen Hamilton EDITS Contract
$919 million for AI-enhanced defense capabilities
NRO Commercial Imagery Contracts
10-year agreements with Maxar, BlackSky, and Planet Labs
Public-Private Partnerships
Accelerating innovation through collaborative models
Technology providers like IBM, HPE, and Thales Group bring crucial AI infrastructure, while emerging players such as Planet Labs, Capella Space, and BlackSky demonstrate how specialized capabilities can carve out significant market niches. Understanding these dynamics through global AI competition visualization reveals opportunities that might otherwise remain hidden in complex market data.

Future Horizons: Emerging Trends and Opportunities
Looking ahead, I'm thrilled by the convergence of next-generation technologies reshaping space exploration. Generative AI is revolutionizing mission planning and simulation, while quantum computing promises to solve complex calculations that were previously impossible. The concept of swarm intelligence for satellite constellations particularly excites me—imagine thousands of satellites working together as a unified, intelligent system.
Emerging Technologies
-
→
Generative AI: Mission planning and simulation
-
→
Quantum Computing: Complex orbital calculations
-
→
Swarm Intelligence: Satellite constellation coordination
-
→
Human-AI Collaboration: Enhanced space station operations
Market Growth Drivers
Challenge-Solution Framework
flowchart LR
                        subgraph Challenges
                            C1[Communication Delays]
                            C2[Cybersecurity Risks]
                            C3[High Implementation Costs]
                            C4[Standardization Needs]
                        end

                        subgraph Solutions
                            S1[Autonomous AI Systems]
                            S2[Blockchain Security]
                            S3[Shared Infrastructure]
                            S4[Industry Protocols]
                        end

                        C1 --> S1
                        C2 --> S2
                        C3 --> S3
                        C4 --> S4

                        S1 --> O1[Enhanced Mission Success]
                        S2 --> O2[Secure Operations]
                        S3 --> O3[Cost Efficiency]
                        S4 --> O4[Interoperability]

                        style C1 fill:#EF5350,stroke:#333,stroke-width:2px,color:#fff
                        style C2 fill:#EF5350,stroke:#333,stroke-width:2px,color:#fff
                        style C3 fill:#EF5350,stroke:#333,stroke-width:2px,color:#fff
                        style C4 fill:#EF5350,stroke:#333,stroke-width:2px,color:#fff

                        style S1 fill:#66BB6A,stroke:#333,stroke-width:2px,color:#fff
                        style S2 fill:#66BB6A,stroke:#333,stroke-width:2px,color:#fff
                        style S3 fill:#66BB6A,stroke:#333,stroke-width:2px,color:#fff
                        style S4 fill:#66BB6A,stroke:#333,stroke-width:2px,color:#fff

                        style O1 fill:#FF8000,stroke:#333,stroke-width:2px,color:#fff
                        style O2 fill:#FF8000,stroke:#333,stroke-width:2px,color:#fff
                        style O3 fill:#FF8000,stroke:#333,stroke-width:2px,color:#fff
                        style O4 fill:#FF8000,stroke:#333,stroke-width:2px,color:#fff
The challenges we face—communication delays in deep space, cybersecurity risks, and high implementation costs—are significant but not insurmountable. I've seen how visualizing these problem-solution frameworks helps teams identify actionable paths forward. With the right AI background for presentations, we can communicate both the challenges and opportunities in ways that inspire action rather than paralysis.

Creating Your AI Space Infographic: Best Practices
Through my journey of creating AI space infographics, I've developed a systematic approach that consistently delivers results. The key is starting with your core message—what specific aspect of AI in space needs clarification for your audience? From there, I layer complexity gradually, moving from overview to technical details in a way that maintains engagement without overwhelming viewers.
My Proven Infographic Creation Process
Define Your Core Message
Identify the specific AI space concept that needs visual clarification. Is it market growth? Technology architecture? Mission workflows?
Layer Complexity Gradually
Start with high-level overview, then add technical details progressively. Use visual hierarchy to guide the viewer's journey.
Maintain Visual Consistency
Use consistent visual language for technology categories. Color-code different AI components for instant recognition.
Incorporate Real Data
Use verified statistics from ESA, NASA, and industry reports. Real mission data adds credibility and impact.
Balance Accuracy with Accessibility
Technical precision is important, but don't sacrifice clarity. Your infographic should speak to both experts and newcomers.
Leverage AI Tools
I've found PageOn.ai's voice/text input invaluable for rapidly iterating design concepts. Instead of spending hours in traditional design software, I can describe my vision and see it materialize instantly.
- • Voice-to-visual generation
- • Deep Search for authentic imagery
- • AI Blocks for modular design
- • Automatic layout optimization
Testing and Validation
Always test your infographic with diverse stakeholder groups. What makes sense to engineers might confuse investors, and vice versa.
- • Mobile responsiveness check
- • Clarity assessment with non-experts
- • Technical accuracy review
- • Presentation context testing
Essential Elements for Every AI Space Infographic
Clear attribution builds trust and credibility
Guide viewers through complex information naturally
Help viewers understand scale and significance
The most successful infographics I've created combine technical accuracy with visual appeal. They tell a story that resonates emotionally while delivering hard data. Remember, your goal isn't just to inform—it's to inspire action and understanding. Whether you're presenting to NASA engineers or venture capitalists, the right visualization can bridge the gap between complex AI concepts and practical applications.

Transform Your Visual Expressions with PageOn.ai
Ready to create stunning AI space infographics that captivate your audience? PageOn.ai's powerful visualization tools make it simple to transform complex data into compelling visual stories. From market analytics to mission workflows, bring your space exploration insights to life with AI-powered design that speaks to both experts and newcomers alike.
Start Creating with PageOn.ai TodayYou Might Also Like
Streamlining Presentation Preparation: Efficient Copy-Pasting Techniques & Smart Integration
Discover advanced copy-paste techniques and AI-powered alternatives to transform your presentation workflow. Learn how to save time and maintain consistency across slides.
Revolutionizing Slides: The Power of AI Presentation Tools | PageOn.ai
Discover how AI presentation tools are transforming slide creation, saving hours of work while enhancing design quality. Learn how PageOn.ai can help visualize your ideas instantly.
Transform Excel Data into Professional Presentations in Minutes | PageOn.ai
Learn how to quickly convert Excel data into stunning professional presentations using AI tools. Save hours of work and create impactful data visualizations in minutes.
Revolutionizing Presentation Development: AI-Powered PowerPoint with MCP Server Technology
Discover how Model Context Protocol (MCP) server technology is transforming PowerPoint presentations through AI integration, creating seamless workflows for dynamic, data-rich visual content.