How Interactive Citation Graphs Transform Academic Research Discovery
From overwhelming reference lists to visual networks that reveal hidden connections
The Challenge of Research Navigation
As I dive into academic research, I'm constantly amazed by the sheer volume of literature available across every discipline. What used to be a manageable collection of journal articles has exploded into millions of papers published annually. Traditional linear search methods—scrolling through database results, following reference lists manually—simply can't keep pace with this information explosion.
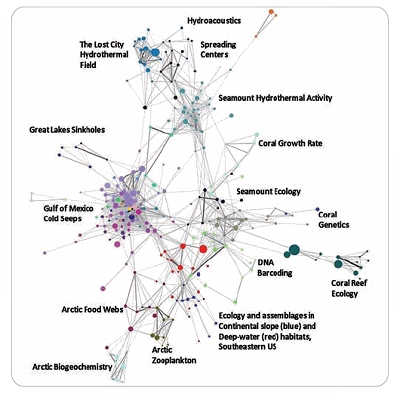
I've discovered that researchers today need visual tools to understand paper relationships effectively. We're witnessing a fundamental shift from static reference lists to dynamic citation networks. These interactive graphs don't just show us what papers exist—they reveal how ideas flow through academic communities, how research builds upon itself, and where the gaps in our knowledge lie.
The transformation is profound: instead of linear searches that might miss crucial connections, we now have tools that map the entire landscape of a research field. This visual approach has changed how I explore new topics, identify influential works, and understand the evolution of ideas across time.
Understanding Citation Graph Technology
At its core, a citation graph consists of nodes representing papers and edges representing citations between them. When I select a seed article, I can explore two primary types of relationships: backward citations (papers my chosen article references) and forward citations (papers that cite my seed article). This bidirectional exploration reveals the intellectual lineage of research ideas.
Citation Network Structure
Below is a visualization of how papers connect through citations:
flowchart LR
                        A[Seed Paper] --> B[Referenced Paper 1]
                        A --> C[Referenced Paper 2]
                        A --> D[Referenced Paper 3]
                        E[Citing Paper 1] --> A
                        F[Citing Paper 2] --> A
                        G[Citing Paper 3] --> A
                        B --> H[Earlier Work]
                        C --> H
                        E --> I[Future Development]
                        F --> I

                        style A fill:#FF8000,stroke:#333,stroke-width:3px
                        style B fill:#e8f4f8
                        style C fill:#e8f4f8
                        style D fill:#e8f4f8
                        style E fill:#f0e8ff
                        style F fill:#f0e8ff
                        style G fill:#f0e8ff
What makes modern citation mapping truly powerful is how similarity metrics go beyond direct citations. I've learned that bibliographic coupling analysis identifies papers that cite similar sources, even if they don't cite each other. Co-citation patterns reveal when two papers are frequently cited together by other works, suggesting thematic connections. Semantic similarity algorithms analyze the actual content of papers, finding conceptual relationships that traditional citation tracking might miss.
These advanced metrics transform a simple list of references into a rich, multidimensional map of knowledge. By leveraging these technologies, I can quickly identify clusters of related research, spot emerging trends, and understand how different research communities approach similar problems from various angles.
Leading Citation Mapping Platforms
Connected Papers
I find Connected Papers particularly intuitive for getting quick snapshots of research areas. Its visual clustering based on similarity—not just citations—helps me understand thematic connections that might not be obvious from citation counts alone. The platform's single origin paper approach with iterative expansion allows me to start simple and gradually build complexity.

What sets Connected Papers apart is its Prior and Derivative works features. These help me identify influential papers that shaped the field and recent developments building on my seed paper. To make the most of these insights, I often leverage PageOn.ai's AI Blocks to structure findings from Connected Papers into visual summaries that clearly communicate complex relationships.
Litmaps
Litmaps offers multi-seed paper capability from the start, which I appreciate when exploring broader topics. The customizable X/Y axes—showing year, citations, or connectivity—provide different perspectives on the same data. Its direct Zotero integration creates a seamless workflow for my research process.
Platform Feature Comparison
Comparing key features across citation mapping tools:
I've found that transforming Litmaps data into compelling narratives becomes effortless with PageOn.ai's Vibe Creation feature, which helps me present citation networks in ways that resonate with different audiences.
Research Rabbit
Research Rabbit stands out with its comprehensive exploration capabilities and unlimited free access. The platform's collections and categories system provides hierarchical organization that matches how I naturally think about research topics. Its timeline view for tracking research evolution has become invaluable for understanding how fields develop over time.
To enhance my Research Rabbit findings, I use PageOn.ai's Deep Search to integrate discoveries with additional visual assets, creating comprehensive research presentations that go beyond simple citation maps.
Other Notable Tools
The ecosystem includes several other valuable tools: Citation Gecko offers browser-based simplicity perfect for quick explorations; Paperverse provides 2-level citation graph visualization that's particularly useful for machine learning research; Inciteful brings a living, dynamic approach with Zotero integration; and VOSViewer excels at advanced bibliometric analysis for systematic reviews.
Practical Applications and Workflows
My literature review process has accelerated from weeks to hours using citation mapping tools. By starting with a few key papers and expanding through citation networks, I can quickly build comprehensive bibliographies that would have taken days of manual searching. The visual nature of these tools helps me identify research gaps through network analysis—those empty spaces in the graph often represent unexplored opportunities.
Research Workflow Process
My systematic approach to citation mapping:
flowchart TD
                        A[Identify Seed Papers] --> B[Generate Initial Map]
                        B --> C{Analyze Clusters}
                        C --> D[Prior Works]
                        C --> E[Similar Papers]
                        C --> F[Derivative Works]
                        D --> G[Identify Foundational Research]
                        E --> H[Discover Related Topics]
                        F --> I[Track Recent Developments]
                        G --> J[Build Bibliography]
                        H --> J
                        I --> J
                        J --> K[Export to Reference Manager]
                        K --> L[Create Visual Presentation]

                        style A fill:#FF8000,stroke:#333,stroke-width:2px
                        style L fill:#66BB6A,stroke:#333,stroke-width:2px
For tracking emerging trends and State of the Art papers, I regularly update my citation maps to catch new publications. The collaborative features in these tools enable shared research maps with colleagues, fostering team-based discovery. When it comes to presenting findings, I visualize complex citation networks with PageOn.ai's drag-and-drop blocks, transforming dense academic connections into clear, compelling narratives.
Building comprehensive bibliographies for theses has become remarkably efficient. I start with core papers I know I'll cite, then use citation mapping to fill gaps and ensure I haven't missed crucial works. This systematic approach has saved me countless hours and improved the quality of my literature reviews.
Strategic Implementation Tips
Through extensive use of these tools, I've developed strategies that maximize their effectiveness. Starting with 2-3 key seed papers maintains clarity while providing enough data for meaningful patterns to emerge. I've learned to follow unexpected citation paths—some of my most valuable discoveries came from papers I wouldn't have found through keyword searches.
Start Small
Begin with 2-3 highly relevant seed papers to maintain focus and avoid information overload.
Explore Broadly
Follow unexpected citation paths to discover interdisciplinary connections.
Filter Wisely
Use date ranges, keywords, and open access filters to refine your results.
Update Regularly
Refresh your citation maps monthly to catch new publications in fast-moving fields.
Using filters effectively—date ranges, keywords, open access status—helps manage information overload. I combine multiple tools for comprehensive coverage, as each platform has unique strengths. Regular updates are crucial; I refresh my maps monthly to catch new publications in rapidly evolving fields.
Creating visual presentations of findings has become essential for communicating research insights. I use PageOn.ai's Agentic features to transform raw citation data into polished presentations that effectively convey complex relationships to diverse audiences, from academic peers to industry stakeholders.
Limitations and Considerations
While citation mapping tools have revolutionized my research process, I've encountered several limitations worth noting. Database coverage gaps are particularly pronounced in humanities fields, where many important works simply aren't indexed. Metadata inconsistencies in specialized journals can lead to missing or misrepresented papers.

Non-English language publications face significant challenges, often appearing with incomplete metadata or being excluded entirely. Books and non-journal sources remain underrepresented, which can be problematic for fields where monographs are primary scholarly outputs. Free tier restrictions and pricing models can limit access for independent researchers or those at institutions without subscriptions.
To address these gaps, I supplement citation mapping with PageOn.ai's comprehensive search capabilities, which help me find and visualize sources that traditional academic databases might miss. This combined approach ensures I'm not overlooking important works due to technical limitations.
Future Directions and Integration
The future of citation mapping looks incredibly promising. AI-powered recommendation improvements are making these tools smarter at identifying relevant papers beyond simple keyword matching. Cross-platform data synchronization is emerging, allowing researchers to maintain consistent citation maps across different tools and devices.
Evolution of Citation Mapping Features
Tracking the development of key capabilities over time:
Enhanced collaboration features are transforming solo research into team efforts, with real-time sharing and annotation capabilities. The integration with reference citation generators streamlines the entire research workflow from discovery to publication.
I'm particularly excited about combining citation mapping with interactive visualizations for data exploration. This convergence will enable researchers to not just map citations but to explore the actual data and findings within papers visually.
Using PageOn.ai to transform citation maps into polished research presentations has become an essential part of my workflow. The platform's ability to take complex network data and create clear, engaging visual narratives bridges the gap between technical analysis and accessible communication.
Transform Your Visual Expressions with PageOn.ai
Ready to turn your citation networks and research insights into stunning visual presentations? PageOn.ai's powerful AI-driven tools help you create compelling narratives from complex academic data. Whether you're presenting findings, writing papers, or sharing discoveries, our platform makes it easy to communicate your research effectively.
Start Creating with PageOn.ai TodayEmbracing the Visual Revolution in Academic Research
Interactive citation graphs have fundamentally changed how I approach academic research. What once required weeks of manual searching and cross-referencing now takes hours, with better results and fewer missed connections. These tools don't replace traditional research methods—they enhance them, providing a visual layer that reveals patterns invisible in linear searches.
The combination of platforms like Connected Papers, Litmaps, and Research Rabbit with visualization tools from PageOn.ai creates a powerful research ecosystem. I can discover, analyze, organize, and present academic knowledge more effectively than ever before. The visual nature of these tools makes complex relationships intuitive, turning overwhelming literature landscapes into navigable maps.
As we move forward, the integration of AI, enhanced collaboration features, and improved visualization capabilities will continue to transform how we interact with academic literature. By embracing these tools and understanding both their capabilities and limitations, we can accelerate discovery, identify new research directions, and communicate our findings more effectively. The future of academic research is visual, interconnected, and more accessible than ever before.
You Might Also Like
Mastering Element Alignment for Professional Learning Layouts | Visual Design Guide
Learn how to create visually engaging professional learning materials through strategic element alignment techniques that enhance information retention and learner engagement.
Building Consistent Design Systems for Enhanced Learning Experiences: A Visual Framework
Discover how to create cohesive educational design systems that improve learning outcomes through visual consistency, reduced cognitive load, and systematic approaches to educational content delivery.
The Art of Text Contrast: Transform Audience Engagement With Visual Hierarchy
Discover how strategic text contrast can guide audience attention, enhance information retention, and create more engaging content across presentations, videos, and marketing materials.
Typography Evolution: From Cave Paintings to Digital Fonts | Visual Journey
Explore typography's rich evolution from ancient cave paintings to modern digital fonts. Discover how visual communication has transformed across centuries and shaped design.