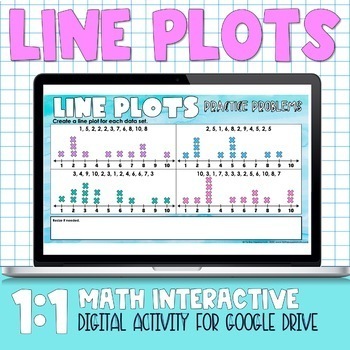
Transform Line Plot Teaching from Confusion to Clarity with Visual Learning Tools
Discover How Interactive Anchor Charts and Hands-On Activities Make Data Visualization Click for Every Student
When I first introduced line plots to my third-grade class, I watched as confusion spread across their faces like ripples in a pond. Those X's stacked on a number line seemed as mysterious as ancient hieroglyphics. But through years of refining my approach with visual tools and interactive methods, I've discovered how to transform this challenging concept into an engaging adventure in data storytelling.
Understanding the Foundation: What Makes Line Plots Challenging
The Disconnect Between Abstract Data and Student Comprehension
I've discovered that the primary challenge with line plots isn't the concept itself—it's the abstract nature of representing frequency with stacked X's. When we introduce line plots, we're asking students to make multiple cognitive leaps simultaneously: understanding that each X represents one occurrence, visualizing how these stack vertically to show frequency, and interpreting what this visual pattern means in the context of real data.

The complexity multiplies when fractions enter the equation. Suddenly, students must navigate not just whole number positions but fractional measurements on the number line. I've watched countless students place their X's between the lines rather than on them, revealing a fundamental misunderstanding about how line plots differ from traditional number lines.
Common Student Misconceptions:
- Confusing line plots with line graphs (connecting dots vs. stacking X's)
- Placing X's randomly instead of above specific values
- Not understanding that height represents frequency
- Struggling with fractional measurements on the number line
Identifying the Gap in Real-World Connections
Here's a confession: in my entire adult life outside the classroom, I've never once created or needed to interpret a line plot. This realization hit me during my third year of teaching when a student asked, "When will we ever use this?" I couldn't give an authentic answer because, unlike bar graphs or pie charts that appear in newspapers and reports, line plots seem confined to educational settings.
This disconnect creates a unique challenge. We're teaching a data representation method that students rarely encounter outside our math lessons. That's why I've learned to frame line plots as a stepping stone—a foundational skill that builds the visual literacy needed for more complex data visualization charts they'll encounter throughout their academic and professional lives.
Building Visual Foundations with Interactive Anchor Charts
Creating Collaborative Learning Through Joint Chart Development
My approach to anchor charts has evolved from pre-made posters to collaborative creations. I start each line plot unit with a blank chart paper and colored markers, building the anchor chart WITH my students rather than FOR them. This co-creation process transforms passive observers into active participants.
Essential Components of Our Line Plot Anchor Chart:
Title
The name that tells us what data we're showing
Symbols (X's)
Each X represents one piece of data or occurrence
Number Line/Categories
The baseline showing possible values or groups
As we build the chart together, I weave in vocabulary naturally. "Let's add another X to show the FREQUENCY increased," I might say, or "Notice how we're stacking the symbols VERTICALLY to show how many times this value appears." This organic introduction of mathematical language feels less intimidating than formal definitions.
Interactive Line Plot Demonstration
Transitioning from Whole-Group to Individual Understanding
While our class anchor chart serves as a reference point, I've found that personal connection deepens understanding. Each student creates a mini anchor chart in their math journal, customizing it with their own examples and color-coding system. Some students prefer rainbow colors for different frequencies, while others use warm colors for high frequencies and cool colors for low ones.

This personalization extends to digital tools as well. Using PageOn.ai's AI Blocks feature, we can structure anchor chart elements digitally, allowing students to manipulate and reorganize components until the concept clicks. The Vibe Creation tool transforms these static charts into interactive visuals where students can add or remove data points and immediately see how the line plot changes—making abstract concepts tangible.
Making Data Collection Come Alive Through Hands-On Activities
Classroom Survey Activities That Connect to Student Experiences
The magic happens when data becomes personal. I start with surveys that matter to my students. "How many siblings do you have?" generates genuine interest because everyone wants to see where they fit in the class dynamic. We collect this data using sticky notes, each student writing their name and placing it above the appropriate number on a floor number line we've created with masking tape.
Engaging Survey Topics That Work:
- Number of letters in your first name
- Minutes spent reading last night
- Favorite season (categorical)
- Birthday month distribution
- Number of pets at home
- Favorite pizza toppings (categorical)
- Height rounded to nearest inch
- Number of books in backpack
For categorical data like "favorite superpower," we discovered that students engage more deeply when options are limited but meaningful. Flying, invisibility, super strength, and mind reading create animated discussions about WHY certain powers are more popular, naturally leading to data analysis conversations.
Student Activity Flow Diagram
flowchart LR
                        A[Collect Data] --> B[Organize Values]
                        B --> C[Create Number Line]
                        C --> D["Plot X's Above Values"]
                        D --> E[Stack for Frequency]
                        E --> F[Analyze Patterns]
                        F --> G[Draw Conclusions]

                        style A fill:#FF8000,color:#fff
                        style G fill:#42A5F5,color:#fff
Measurement-Based Activities for Kinesthetic Learners
My breakthrough moment came when I introduced the "Paper Bag Mystery Measurement" activity. I fill bags with various classroom objects—erasers, paper clips, crayons, small toys—all carefully selected to have lengths clustering around certain measurements. Students pull items, measure to the nearest half-inch, and plot their findings.
"Blow, Measure, and Plot" Activity Setup:
- Place masking tape starting line on floor
- Give each student a pom-pom and straw
- Students blow pom-pom as far as possible
- Measure distance to nearest inch
- Plot measurement on class line plot
- Repeat 3 times, analyzing changes in distribution

This activity generates authentic excitement while reinforcing measurement skills and data collection. Students naturally begin making predictions: "I bet most pom-poms will land between 20 and 30 inches!" These predictions lead to rich discussions about data distribution and the difference between line graphs to visualize trends versus line plots for showing frequency.
Integrating Mathematical Concepts for Deeper Understanding
Connecting Line Plots to Existing Math Knowledge
One of my most successful strategies involves weaving line plots into our existing math curriculum rather than treating them as an isolated unit. During our place value lessons, we create "Find the Value and Plot" activities where students decode numbers (like 3 tens and 4 ones = 34) and then plot how frequently each value appears in a set.
Mathematical Connections Activities:
Roll, Add, and Plot
Students roll two dice, add the numbers, and plot the sum. After 20 rolls, they analyze which sums appear most frequently and discuss why (probability connection!).
Fraction Line Plots
Measure pencils to the nearest quarter inch, creating line plots with fractional values. This bridges measurement and fraction concepts beautifully.
Skip Counting Patterns
Plot multiples of 3, 5, or 7 up to 50, revealing visual patterns in our number system through data representation.
Progressive Complexity in Questioning Strategies
I've developed a three-tier questioning approach that scaffolds student thinking from basic recall to complex analysis. This progression ensures every student can enter the conversation while pushing advanced learners to think critically.
Question Complexity Progression
Progressive Question Examples:
- Basic: "How many students have exactly 3 pets?"
- Intermediate: "How many more students have 2 pets than 4 pets?"
- Advanced: "If each pet eats 2 cups of food daily, how many total cups of food do all the 3-pet families need?"
- Critical Thinking: "Based on this data, predict how many students in a class of 100 would likely have 2 pets."
Digital Enhancement and Modern Teaching Approaches
Transforming Traditional Line Plots into Interactive Experiences
The shift to digital learning opened unexpected doors for teaching line plots. Using Google Slides, I create interactive line plots where students can drag and drop X symbols onto a number line. This simple modification transforms a static concept into a dynamic experience where mistakes become learning opportunities rather than eraser marks.
What excites me most is the ability to create animated line plots that build progressively. Students watch as data points appear one by one, stacking to show frequency. This animation helps visual learners understand that each X represents a single data point, not just a decorative mark.
Digital Enhancement Features:
- Instant feedback on placement accuracy
- Color-coding for different data sets
- Automatic frequency counting
- Save and share capabilities for peer review
- Integration with spreadsheet data for real-time updates
Assessment and Differentiation Strategies
Digital tools have revolutionized my assessment approach. I now use exit tickets created with forms that automatically generate line plots from student responses. This immediate visualization helps me identify misconceptions before they solidify.
For differentiation, I create tiered digital activities. Struggling students work with whole numbers and clear categories, while advanced learners tackle fractional measurements and multi-step analysis questions. The beauty of digital platforms is that all students appear to be doing the same activity, preserving dignity while meeting individual needs.
These digital line plots can be enhanced further by exploring concepts similar to horizontal bar charts, helping students see connections between different data visualization methods.
Cross-Curricular Connections and Real-World Applications
Science Integration Opportunities
My favorite cross-curricular connection emerged during our plant unit. We became botanists, measuring leaves collected from around the school grounds. Students used centimeter rulers (because "real scientists use metric"), measured ten leaves each, and created individual line plots before combining data for a class visualization.
Science Data Collection Process
flowchart TD
                            A[Collect Specimens] --> B[Measure Accurately]
                            B --> C[Record in Science Journal]
                            C --> D[Create Individual Line Plot]
                            D --> E[Combine Class Data]
                            E --> F[Analyze Patterns]
                            F --> G[Form Scientific Conclusions]

                            style A fill:#66BB6A,color:#fff
                            style G fill:#FF8000,color:#fff
Science Integration Projects:
Weather Tracking
Daily temperature readings plotted over a month, revealing climate patterns
Plant Growth
Weekly height measurements of bean plants under different conditions
Rock Collection
Categorizing rocks by weight ranges, creating geological data sets
Insect Survey
Types of insects found in different school yard locations
Movement-Based Learning Activities
Physical education becomes a data goldmine when we bring line plots into play. During our fitness unit, students track their jump rope counts, creating personal line plots showing improvement over two weeks. The visual representation of progress motivates students more than any verbal encouragement I could offer.
My students' absolute favorite is "Dance Around and Plot." I arrange shape cards in a circle, play music, and when it stops, students plot which shape they landed on. After ten rounds, we analyze which shapes were most "popular" (really just random chance, but they don't need to know that yet!). This activity gets everyone moving while reinforcing data collection skills.
These movement activities naturally lead to discussions about comparing multiple data sets, similar to using comparison chart creation tools for analyzing different groups or time periods.
Building Long-Term Understanding and Retention
Creating Reference Materials for Continued Learning
The anchor charts we create together don't disappear after the unit ends. I've learned to be strategic about which charts earn permanent wall space. Our line plot anchor chart lives above our data center all year, accumulating sticky notes with new discoveries and connections students make across subjects.
Students maintain line plot sections in their math journals that grow throughout the year. They add new examples, paste in mini-assessments they're proud of, and write reflections about when line plots work better than other graph types. These personal references become invaluable when students encounter line plots in standardized testing or subsequent grades.
Student Portfolio Components:
- Personal anchor chart with color-coding system
- Collection of completed line plots with self-assessment notes
- Comparison chart showing line plots vs. other graph types
- Real-world examples found in magazines or online
- "Teaching Page" where students explain line plots to next year's class
Connecting to Other Graphing Concepts
I explicitly teach the relationships between line plots and other data representations. We create the same data set as a line plot, bar graph, and pictograph, discussing which representation best tells the data's story. This comparative approach helps students understand that line plots excel at showing frequency distribution of individual values.
Graph Type Comparison
This foundation prepares students for more complex data analysis in upper grades. When they eventually encounter spreadsheet software, they'll understand the concepts behind creating a bar chart in Excel because they grasp the underlying principles of data visualization.
Assessment Strategies That Showcase True Understanding
My favorite assessment isn't a test—it's a "Data Detective" project where students collect their own data, create a line plot, and present their findings to the class. Last year, one student tracked how many minutes it took her to fall asleep each night for two weeks. Her line plot revealed a pattern: longer times on Sunday nights, leading to a discussion about weekend sleep schedules!
Peer teaching provides another powerful assessment opportunity. Students pair up with younger grades to teach line plot basics. Nothing reveals understanding gaps faster than trying to explain a concept to a second-grader. Plus, my students feel like experts, boosting their confidence alongside their competence.
Transform Your Visual Expressions with PageOn.ai
Just as we've transformed line plots from confusing abstractions into engaging visual stories, PageOn.ai empowers you to turn any complex information into clear, compelling visual narratives. Whether you're creating educational materials, presenting data insights, or building interactive learning experiences, our AI-powered tools make professional visualization accessible to everyone.
Start Creating with PageOn.ai TodayTransforming Data into Understanding
Teaching line plots has taught me that the most abstract concepts become concrete when we connect them to students' lived experiences. Every X on a line plot represents something real—a pet, a measurement, a moment in time. When students understand this connection, they're not just learning to create graphs; they're learning to tell stories with data.
The journey from confusion to clarity doesn't happen overnight. It requires patient scaffolding, creative activities, and a willingness to let students explore data in ways that make sense to them. Some students will connect through hands-on measurement, others through digital manipulation, and still others through cross-curricular applications.
What I've discovered is that line plots, despite their initial challenge, offer a unique window into mathematical thinking. They bridge counting and measuring, concrete and abstract, individual data points and collective patterns. When students master line plots, they've gained more than a graphing skill—they've developed a new lens for viewing and interpreting the world around them.
As educators, our role is to provide the tools, experiences, and support that transform those mysterious X's into meaningful insights. With interactive anchor charts, engaging activities, and thoughtful integration across the curriculum, we can guide every student from that initial moment of confusion to the satisfaction of true understanding. And in that transformation, we're not just teaching math—we're empowering young minds to visualize, analyze, and communicate in the language of data.
You Might Also Like
Mastering MCP Architecture: The Ultimate Blueprint for Seamless AI-Data Integration
Explore the Model Context Protocol architecture that solves the N×M integration problem. Learn how MCP creates standardized connections between AI systems and data sources.
Crafting Indonesia's Story: Visual Narratives That Captivate Global Audiences
Discover how to create compelling visual narratives about Indonesia that engage global audiences. Learn strategies for showcasing Indonesia's cultural diversity, geography, and economic potential.
Crafting Emotionally Resonant Digital Experiences: AI-Powered Vibe Design
Explore how AI-powered vibe design is transforming digital interfaces from functional to emotionally resonant experiences. Learn techniques for creating interfaces that connect with users on a deeper level.
Navigating the MCP Ecosystem: Transform Your AI Development Strategy
Explore how the rapidly growing MCP ecosystem is revolutionizing AI development, with market projections reaching $10.3B by 2025 and how to implement your MCP strategy.