Transform Your Data Into Dynamic Column Charts
A Visual Storytelling Guide
In today's data-driven world, I've discovered that the ability to transform raw numbers into compelling visual stories isn't just a nice-to-have—it's essential. Let me guide you through the art and science of creating professional column charts online, turning your complex data into clear, actionable insights that resonate with any audience.
Why Column Charts Matter for Modern Data Communication
I've spent years working with data, and if there's one thing I've learned, it's that presenting comparative data effectively in today's information-rich environment is one of our greatest challenges. We're drowning in numbers, yet starving for insights. That's where column charts come in as my go-to solution.
Column charts have become the gold standard for categorical comparisons and time-series visualization, and for good reason. They leverage our brain's natural ability to compare heights, making complex data instantly understandable. When I need to show quarterly sales, survey results, or any categorical comparison, column charts deliver that "aha!" moment faster than any other visualization type.
What truly excites me is how visual clarity transforms raw numbers into actionable insights. I've watched executives make million-dollar decisions based on a well-designed column chart that would have been impossible with a spreadsheet full of numbers. The human brain processes visual information 60,000 times faster than text—that's the power we're harnessing.
To streamline this transformation, I often leverage PageOn.ai's "Turn Fuzzy Thought into Clear Visuals" capability. It's like having a visualization expert on call—I can describe my data story in natural language, and it instantly helps me conceptualize the most effective way to present it. This AI-powered approach has revolutionized how quickly I can move from data to insight.
Understanding Column Chart Architecture and Design Principles
Let me break down the anatomy of an effective column chart. Understanding these core components—axes, bars, labels, and their visual hierarchy—is crucial for creating charts that communicate clearly rather than confuse.
Column Chart Component Architecture
                    flowchart TD
                        A[Column Chart] --> B[X-Axis]
                        A --> C[Y-Axis]
                        A --> D[Data Bars]
                        A --> E[Labels]
                        A --> F[Legend]

                        B --> B1[Categories]
                        B --> B2[Time Periods]

                        C --> C1[Values]
                        C --> C2[Scale]

                        D --> D1[Height = Value]
                        D --> D2[Width = Consistency]
                        D --> D3[Color = Series]

                        E --> E1[Title]
                        E --> E2[Axis Labels]
                        E --> E3[Data Labels]

                        F --> F1[Series Names]
                        F --> F2[Color Mapping]
When choosing column charts over other data visualization charts, I consider the nature of my data. Column charts excel when I need to compare discrete categories or show changes over time periods. They're particularly powerful for showing rankings, comparing parts to a whole, or tracking performance metrics.
Data Structure Requirements
I've learned that successful column charts start with properly structured data. The distinction between categorical and continuous data is fundamental—categories go on the x-axis (months, products, regions), while continuous values populate the y-axis (sales, percentages, counts).
For optimal visualization, I keep my data ranges reasonable. Too many categories (more than 12-15) make the chart cluttered, while too few (less than 3) might not justify a chart at all. When handling multiple data series, I limit myself to 3-4 series maximum to maintain clarity.
Visual Enhancement Techniques
Color coding is where art meets science in column chart design. I use a consistent color scheme where each color has meaning—perhaps blue for actual values, orange for targets, and gray for previous periods. This consistency helps viewers quickly understand patterns across multiple charts.
Interactive Column Chart Example
Adding context through annotations and reference lines transforms a simple chart into a story. I often include a horizontal line showing the average or target, making it immediately clear which categories exceed or fall short of expectations. These small additions provide the "so what?" that viewers need.
Building Column Charts with Modern Online Tools
I've tested dozens of online column chart makers, and the landscape has dramatically improved. Free tools like DesignCap, TabLab, GraphMaker, LiveGap, and ChartGo now offer professional-grade capabilities that rival expensive software. Let me share what I've learned about choosing and using these tools effectively.

The essential features I look for include real-time preview (seeing changes instantly as I adjust settings), extensive customization options (colors, fonts, sizes), and flexible export formats (PNG for presentations, SVG for web, CSV for data sharing). The best tools combine these with an intuitive interface that doesn't require a manual.
My typical workflow starts with data preparation, moves through tool selection and input, then focuses on customization and refinement. I've found that utilizing PageOn.ai's AI Blocks helps me structure this process like building with LEGOs—each block represents a step, making complex visualizations manageable and repeatable.
Data Input Methods
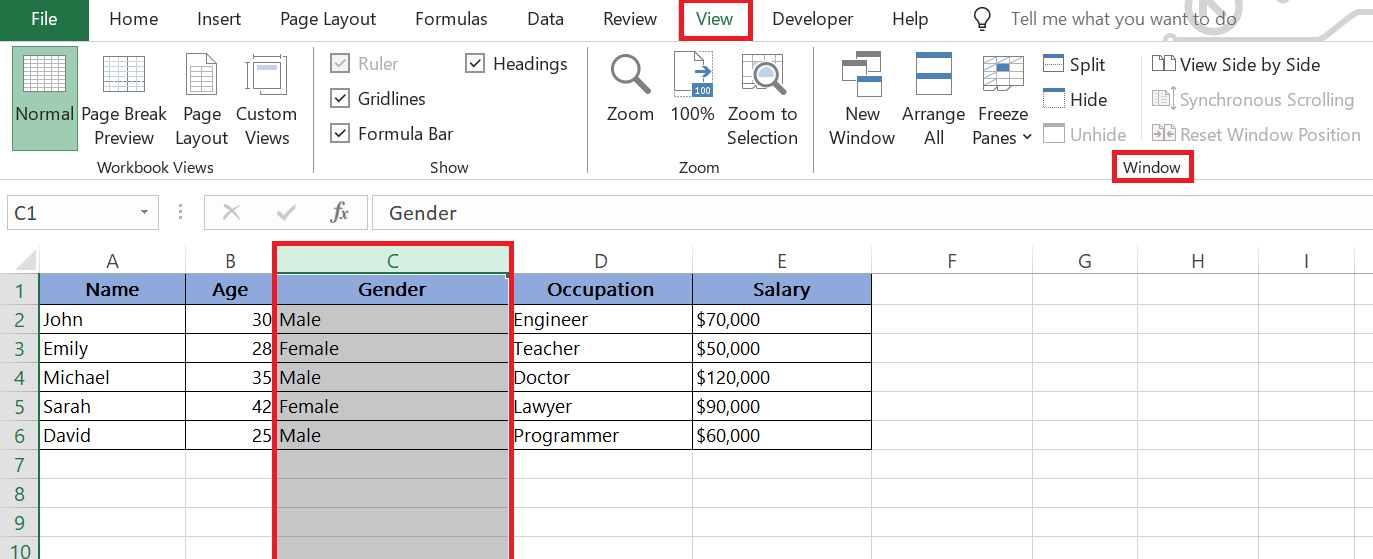
The way I input data depends on the project. For quick visualizations, manual entry works fine—most tools provide a simple table interface. But for larger datasets, I rely on CSV or Excel import functionality. The ability to copy-paste directly from spreadsheets has saved me countless hours.
Some advanced tools now offer API connections for dynamic data updates. This is game-changing for dashboards that need real-time updates. I can connect directly to databases or web services, ensuring my charts always show the latest information.
Customization Capabilities
Template selection has become my starting point. Rather than building from scratch, I choose a template that's close to my vision, then modify it. This approach combines efficiency with customization—I get professional design patterns while maintaining control over the final look.
| Tool | Best For | Key Features | Export Options |
|---|---|---|---|
| ChartGo | Quick charts | 15+ years reliable, pattern fills | PNG, SVG, HTML |
| LiveGap | Live preview | Real-time editing, 50+ templates | Image, HTML, CSV |
| DesignCap | Design focus | Professional templates, branding | High-res images |
Interactive elements like tooltips, animations, and hover effects elevate static charts into engaging experiences. When viewers can explore the data themselves—hovering to see exact values, clicking to filter series—they develop a deeper understanding of the information.
Advanced Techniques for Professional Column Charts
After mastering the basics, I've discovered advanced techniques that transform good column charts into exceptional ones. These methods help me tackle complex data scenarios while maintaining clarity and impact.
Creating stacked and clustered column variations opens up new possibilities for data comparison. Stacked columns show both individual components and totals simultaneously—perfect for budget breakdowns or market share analysis. Clustered columns excel at side-by-side comparisons across multiple categories.
Stacked Column Chart: Market Share Analysis
Implementing dual-axis column charts requires careful consideration. I use them sparingly, only when comparing metrics with different scales (like revenue in millions and growth percentage). The key is clear labeling and visual distinction between the two axes to prevent misinterpretation.
Mobile-responsive design has become non-negotiable. I ensure my column charts adapt gracefully to smaller screens by adjusting bar widths, rotating labels when necessary, and prioritizing the most important data when space is limited. Testing across devices is crucial—what looks perfect on desktop might be unreadable on mobile.
I've started integrating PageOn.ai's Deep Search capability to automatically find and incorporate relevant benchmarks and industry data. This feature has been invaluable for adding context—my charts can now show not just our performance, but how we compare to industry standards, all sourced and verified automatically.
Statistical Enhancements
Adding error bars and confidence intervals transforms column charts from simple comparisons into statistically rigorous visualizations. When presenting research data or survey results, these additions communicate uncertainty and reliability, building trust with analytical audiences.

Incorporating trendlines and forecasts adds predictive power to historical data. I often overlay a trend line to show the overall direction, making it easier to spot whether recent changes align with or deviate from long-term patterns.
Storytelling Through Visual Hierarchy
Emphasizing key data points through design is an art I've refined over years. I use techniques like highlighting the current period in a brighter color, adding callout boxes for exceptional values, or using patterns to draw attention to specific categories.
Creating visual flow guides viewer attention naturally through the data story. I start with an overview, then progressively reveal details, using animation or progressive disclosure in interactive charts. Combining column charts with complementary visualizations—perhaps a pie chart showing the breakdown of the largest column—creates a richer narrative.
Real-World Applications and Case Studies
Let me share how I've applied column charts across various industries and scenarios. These real-world examples demonstrate the versatility and power of well-crafted column visualizations.
In sales performance tracking, I use column charts to display monthly revenue comparisons. The visual immediately highlights seasonal patterns, growth trends, and anomalies. Adding year-over-year comparisons as grouped columns provides historical context that spreadsheets simply can't match.
Survey results visualization has become one of my favorite applications. Customer satisfaction metrics displayed as columns make it easy to identify areas needing improvement. I often use stacked columns to show the distribution of responses (very satisfied, satisfied, neutral, dissatisfied) while the total height shows response volume.
Multi-Metric Performance Dashboard
Financial reporting through quarterly earnings presentations benefits immensely from column charts. I create multi-series columns comparing revenue, profit, and expenses across quarters, making trends immediately apparent to stakeholders. Color-coding positive and negative values (green for growth, red for decline) adds instant clarity.
Educational data analysis, particularly student performance tracking, has shown me how column charts can drive instructional decisions. Comparing test scores across subjects, classes, or time periods helps educators identify where to focus their efforts. I use PageOn.ai's Agentic capabilities to transform these complex datasets into polished, presentation-ready visuals that tell a clear story about student achievement.
Industry-Specific Examples
In e-commerce, I track conversion rates across channels using grouped column charts. Each channel (organic search, paid ads, social media, email) gets its own column, grouped by time period. This visualization immediately shows which channels deliver the best ROI and how performance changes over time.
Healthcare applications have taught me the importance of clarity in life-critical data. Patient outcome tracking by treatment type uses column charts to compare success rates, recovery times, and complication rates. The visual nature helps medical teams quickly identify the most effective treatments.
Manufacturing facilities use my column charts to display production output comparisons. Each facility gets a column, with colors indicating whether they're meeting targets. Adding a horizontal line for the production goal makes performance assessment instantaneous.
Marketing campaign performance metrics come alive through column charts. I compare click-through rates, conversion rates, and ROI across campaigns, making it easy to identify winning strategies and allocate budgets effectively.
Optimizing Column Charts for Different Platforms
Creating a great column chart is only half the battle—ensuring it looks perfect across all platforms is equally important. I've learned this through countless presentations, reports, and web deployments where a beautiful chart on my screen became illegible elsewhere.
For web embedding, HTML5 and responsive design are non-negotiable. I ensure my charts use relative sizing rather than fixed pixels, allowing them to adapt to different screen sizes. Libraries like Chart.js provide responsive options out of the box, but I always test across devices to confirm proper rendering.
Print optimization requires different considerations. I switch to higher resolutions (at least 300 DPI) and adjust color modes from RGB to CMYK when necessary. I've learned to avoid relying solely on color for differentiation—patterns and textures ensure charts remain readable even in black and white printing.
Presentation formats like PowerPoint and Google Slides have their own quirks. I export charts at specific aspect ratios (16:9 for modern presentations) and ensure text remains legible when projected. Embedding live charts versus static images is a strategic choice—live charts offer interactivity but risk technical issues during presentations.
Social media sharing demands attention to aspect ratios and file formats. LinkedIn prefers 1.91:1 ratios, Twitter works best with 2:1, and Instagram loves squares. I create platform-specific versions rather than using one-size-fits-all approaches, ensuring maximum engagement.
Export Options and Best Practices
The PNG versus SVG decision depends on use case. PNG works everywhere and maintains consistent appearance, making it my default for presentations and reports. SVG offers infinite scalability and smaller file sizes for simple charts, perfect for web deployment where responsiveness matters.
Resolution requirements vary dramatically. Screen display needs 72-96 DPI, standard printing requires 300 DPI, and professional publishing might demand 600 DPI or higher. I always export at the highest resolution needed, then create lower-resolution versions as required.
Maintaining visual quality across platforms requires attention to detail. I embed fonts when possible, use web-safe alternatives when not, and always include fallback options. Color profiles matter too—sRGB for web, Adobe RGB for professional work, and careful CMYK conversion for print.
Comparison with Alternative Visualization Methods
While I'm passionate about column charts, choosing the right visualization for your data is crucial. Let me share when to use column charts versus alternatives, helping you make informed decisions for your specific needs.
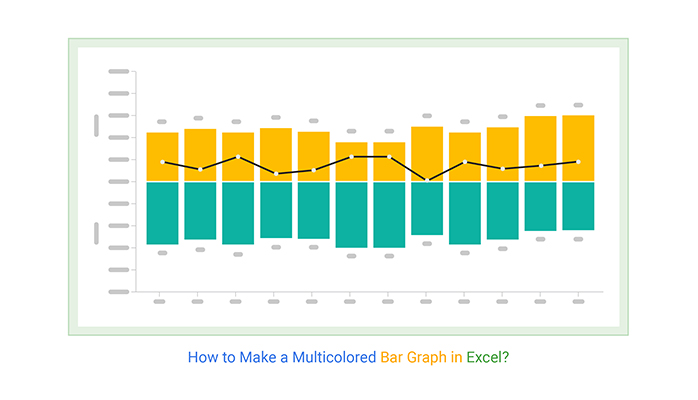
The column versus bar chart in Excel debate often comes down to orientation. I use column charts (vertical bars) for time-series data where we naturally read left-to-right chronologically. Horizontal bar charts excel when category names are long or when ranking items from highest to lowest.
Chart Selection Decision Tree
                    flowchart TD
                        Start[What's Your Data Type?] --> TimeData{Time-Based?}
                        Start --> CatData{Categorical?}
                        Start --> PartWhole{Part-to-Whole?}

                        TimeData -->|Yes| LineChart[Line Chart]
                        TimeData -->|With Categories| ColumnChart[Column Chart]

                        CatData -->|Comparison| CompTools[Use Comparison Tools]
                        CatData -->|Ranking| BarChart[Horizontal Bar Chart]

                        PartWhole -->|Yes| PieChart[Pie/Donut Chart]
                        PartWhole -->|Over Time| StackedColumn[Stacked Column Chart]

                        CompTools --> CompCharts[Comparison Charts]
                        CompCharts --> AIGen[AI Chart Generators]

                        style ColumnChart fill:#FF8000,color:#fff
                        style CompCharts fill:#42A5F5,color:#fff
                        style AIGen fill:#66BB6A,color:#fff
Knowing when to use comparison chart creation tools instead has saved me from forcing data into inappropriate formats. When comparing multiple metrics with different scales, radar charts or parallel coordinates might serve better than columns. For showing relationships between variables, scatter plots reveal patterns columns can't capture.
I've been exploring AI-powered bar chart generators for automated insights. These tools analyze your data and suggest optimal visualizations, often revealing patterns I might have missed. They're particularly valuable when dealing with large datasets where manual analysis would be time-consuming.
The emergence of AI chart generators has revolutionized how I handle complex data scenarios. These tools can automatically determine the best chart type, suggest data transformations, and even generate multiple complementary visualizations that tell a complete story.
| Chart Type | Best Use Case | Strengths | Limitations |
|---|---|---|---|
| Column Chart | Category comparisons, time series | Intuitive, precise value reading | Limited categories, single scale |
| Line Chart | Trends over time | Shows continuity, multiple series | Not for categories |
| Pie Chart | Part-to-whole relationships | Shows proportions clearly | Limited slices, no trends |
| Scatter Plot | Correlations, distributions | Shows relationships | Requires statistical knowledge |
Future-Proofing Your Data Visualization Strategy
The visualization landscape evolves rapidly, and I've learned that staying ahead means embracing emerging technologies while maintaining timeless design principles. Let me share my approach to building a sustainable visualization strategy.
Emerging trends in interactive column chart design excite me. We're moving beyond static images to fully interactive experiences where users can drill down into data, filter on the fly, and even modify parameters to see different scenarios. WebGL-powered 3D columns are becoming feasible for special cases, though I use them sparingly to avoid overwhelming viewers.
Integration with business intelligence platforms has become essential. Modern column charts need to connect seamlessly with tools like Tableau, Power BI, and Google Data Studio. I ensure my visualizations can be embedded, updated dynamically, and maintain consistency across platforms.

Real-time data visualization possibilities have transformed how I think about column charts. Instead of monthly updates, I can now create charts that refresh every second, showing live sales, website traffic, or system performance. The challenge is balancing real-time updates with visual stability—too much movement can be distracting.
I've been leveraging PageOn.ai's Vibe Creation feature to instantly generate column charts through natural conversation. Instead of clicking through menus and options, I simply describe what I want: "Create a column chart comparing Q4 sales across regions with our brand colors." The AI understands context, applies best practices, and delivers professional results in seconds.
Building a scalable visualization workflow for recurring reports has saved me countless hours. I've created templates for common chart types, established data pipelines for automatic updates, and documented style guides for consistency. This systematic approach means new team members can create on-brand visualizations immediately.
Adoption Timeline for Emerging Visualization Technologies
The convergence of AI and visualization excites me most. Imagine column charts that automatically adjust their design based on the audience, highlight anomalies without being asked, or suggest complementary visualizations to complete the story. We're not far from this reality.
As I look ahead, I see column charts remaining fundamental to data communication, but enhanced by AI, interactivity, and real-time capabilities. The tools will become more intelligent, the creation process more intuitive, and the results more impactful. By staying curious, embracing new technologies, and maintaining focus on clear communication, we can ensure our visualizations continue to transform data into understanding.
Transform Your Visual Expressions with PageOn.ai
Ready to revolutionize how you create column charts and data visualizations? PageOn.ai combines the power of AI with intuitive design tools to help you transform complex data into stunning visual stories in seconds, not hours.
Start Creating with PageOn.ai TodayYou Might Also Like
Transforming Raw Data into Stunning Presentations with Cloud AI Integration
Discover how to leverage cloud AI integration to transform raw data into compelling visual stories. Learn advanced techniques for data visualization and presentation creation.
Visualizing Momentum: Creating Traction Timelines That Win Investor Confidence
Learn how to build compelling traction timelines that prove startup momentum to investors. Discover visualization techniques and best practices for showcasing growth and product-market fit.
Transform Your Presentations: Mastering Slide Enhancements for Maximum Impact
Learn how to elevate your presentations with effective slide enhancements, formatting techniques, and visual communication strategies that captivate audiences and deliver powerful messages.
Crafting Indonesia's Story: Visual Narratives That Captivate Global Audiences
Discover how to create compelling visual narratives about Indonesia that engage global audiences. Learn strategies for showcasing Indonesia's cultural diversity, geography, and economic potential.