Transforming Mental Health Data into Visual Stories That Heal and Educate
Breaking Down Complex Mental Health Concepts Through the Power of Visual Communication
The Visual Revolution in Mental Health Communication
I've witnessed firsthand how the mental health landscape is transforming before our eyes. With 25% of youth aged 10-24 feeling unsupported and 45% reporting mental health challenges, we're facing an unprecedented crisis that demands innovative communication approaches.
The power of visual communication in breaking down complex mental health concepts cannot be overstated. Our brains process visuals 60,000 times faster than text – a fact that's revolutionizing how we approach mental health education. Traditional text-heavy resources, while valuable, often fail to engage modern audiences who are accustomed to consuming information through visual narratives.
This is where PageOn.ai's innovative "Turn Fuzzy Thought into Clear Visuals" approach becomes transformative. By converting abstract mental health concepts into concrete visual expressions, we're not just sharing information – we're creating connections, fostering understanding, and ultimately, saving lives.
The Science Behind Visual Mental Health Communication
Understanding how our brains process mental health information through visual channels has been a game-changer in my approach to creating educational materials. The neurological pathways activated by visual stimuli create deeper, more lasting impressions than text alone.
Visual Processing in Mental Health Communication
The following diagram illustrates how visual information flows through our cognitive systems:
flowchart TD
                        A[Visual Stimulus] --> B[Occipital Lobe Processing]
                        B --> C[Pattern Recognition]
                        C --> D[Emotional Response]
                        D --> E[Memory Formation]
                        E --> F[Behavioral Change]

                        B --> G[Color Psychology Impact]
                        G --> D

                        C --> H[Symbolic Understanding]
                        H --> E
The psychology of color plays a crucial role in mental health infographics. I've found that calming blues and greens can reduce anxiety when presenting sensitive topics, while bold, warm colors like our brand's #FF8000 orange can energize and inspire action for awareness campaigns.
Research consistently shows that infographics increase information retention by 65% – a statistic that becomes even more significant when we're dealing with life-saving mental health information. By breaking the stigma barrier through approachable, non-clinical visual narratives, we make mental health conversations accessible to everyone.
With PageOn.ai's Vibe Creation feature, I can transform clinical concepts into conversational visuals that resonate with diverse audiences. This approach turns intimidating medical terminology into relatable, human-centered stories that encourage help-seeking behavior and reduce stigma.
Essential Components of Effective Mental Health Infographics
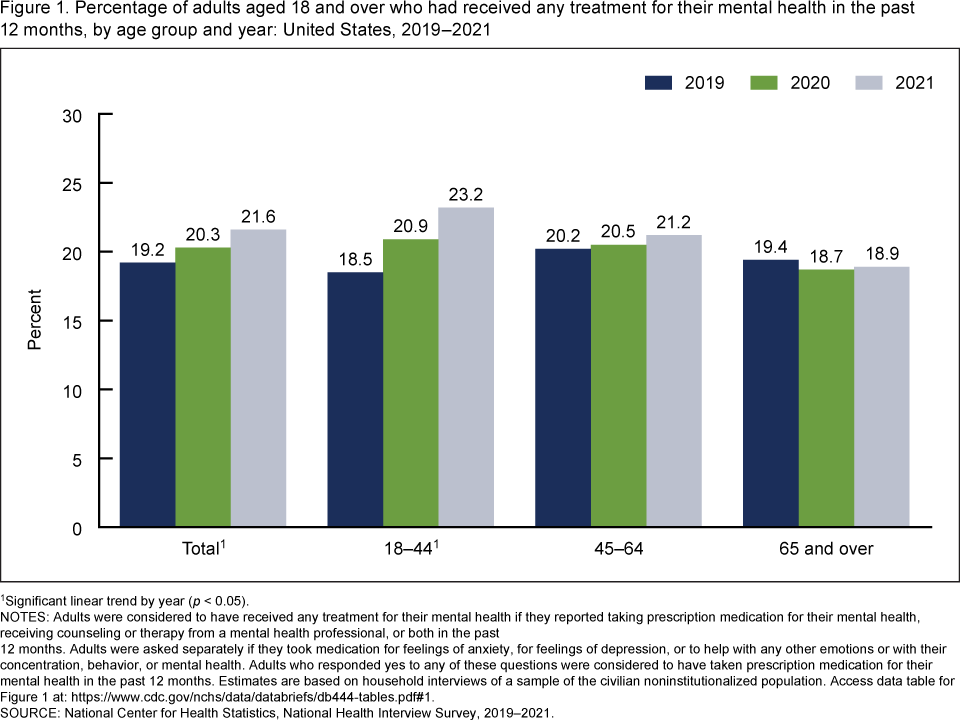
Data Visualization for Impact
Transforming alarming statistics into actionable insights requires a delicate balance. When I present data showing that 81% of workplaces are increasing their mental health focus, I ensure this information empowers rather than overwhelms viewers.
Mental Health Awareness Growth Across Sectors
The following chart shows the increasing focus on mental health across different sectors:
Best practices I've developed for presenting sensitive data include using data visualization charts that balance urgency with hope. It's crucial to avoid overwhelming viewers while still conveying the importance of mental health awareness.
PageOn.ai's Deep Search feature has been invaluable in automatically integrating relevant mental health statistics and research, ensuring my infographics are always backed by the latest credible data.
Visual Storytelling Elements
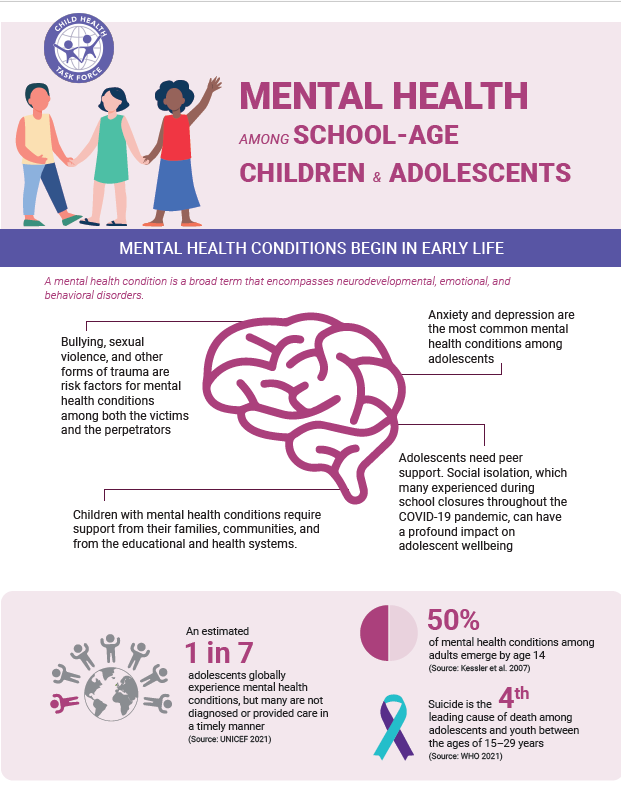
Icon selection and symbolism form the foundation of effective mental health visuals. I often use brain illustrations to represent cognitive processes, weather metaphors for emotions (storms for anxiety, sunshine for recovery), and interconnected figures to symbolize community support.
Creating visual hierarchies that guide viewers through complex mental health topics requires careful consideration of information flow. I structure content to lead the eye naturally from problem identification to understanding to action steps.
PageOn.ai's AI Blocks have revolutionized my workflow, allowing me to build modular, adaptable mental health content that can be customized for different audiences while maintaining visual consistency and professional quality.
Designing for Different Audiences and Contexts
Workplace Mental Health Visuals
In my work with corporate clients, I've learned that addressing employee burnout and stress requires a professional yet approachable visual language. With statistics showing 80% of marketers report being overworked, creating accessible resources for HR departments and managers has become critical.
Key Elements for Workplace Mental Health Infographics:
- Professional color schemes that maintain corporate credibility
- Clear action steps for managers to support team members
- Anonymous self-assessment tools and resources
- Integration with existing workplace wellness programs
Using PageOn.ai's Agentic features, I can customize content for specific organizational cultures, ensuring that mental health resources resonate with each company's unique values and communication style.
Youth and Educational Settings
Adapting complex concepts for children and teens requires special consideration, especially since ages 6-11 are crucial for self-esteem development. I create school-friendly designs that encourage help-seeking behavior without triggering anxiety or fear.
Parent and caregiver resources need actionable guidance presented in digestible formats. I incorporate interactive elements through PageOn.ai's drag-and-drop AI Blocks, allowing educators to customize materials for their specific student populations.
Community and Cultural Considerations
Designing inclusive visuals for BIPOC, LGBTQ+, and minority communities requires deep cultural sensitivity and authentic representation. I've learned that addressing cultural stigmas through representative imagery can significantly increase engagement and trust.
Multi-language accessibility and cultural adaptation strategies are essential. PageOn.ai's Deep Search helps me find culturally relevant visual assets that resonate with diverse communities, ensuring our mental health messages reach everyone who needs them.
Practical Applications and Real-World Impact
Awareness Campaigns
Mental Health Awareness Month strategies require visual themes that capture attention while maintaining sensitivity. I develop comprehensive campaign materials optimized for various platforms – Instagram carousels, Facebook posts, and LinkedIn articles – each tailored to platform-specific engagement patterns.
Multi-Platform Campaign Strategy
Here's how I structure visual content across different social media platforms:
flowchart LR
                        A[Core Message] --> B[Instagram]
                        A --> C[Facebook]
                        A --> D[LinkedIn]
                        A --> E[Twitter/X]

                        B --> F[Visual Stories]
                        B --> G[Carousel Posts]

                        C --> H[Shareable Graphics]
                        C --> I[Video Content]

                        D --> J[Professional Infographics]
                        D --> K[Article Graphics]

                        E --> L[Quick Stats]
                        E --> M[Thread Graphics]
Creating shareable content that drives engagement while reducing stigma requires balancing emotional appeal with factual accuracy. Each piece must inspire action without overwhelming the viewer.
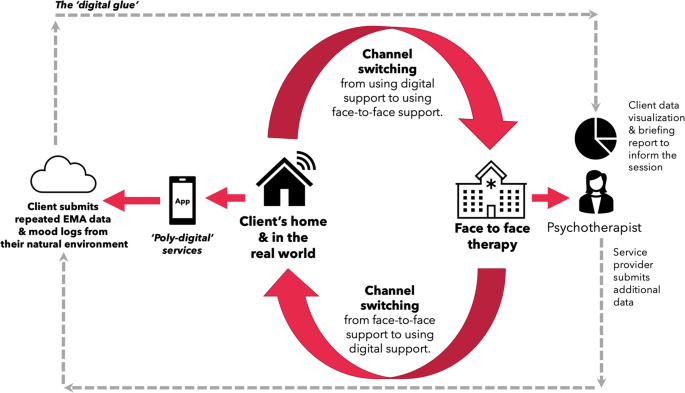
Clinical and Therapeutic Tools
In collaboration with mental health professionals, I've developed patient education materials and symptom trackers that transform clinical information into accessible visual guides. These tools include therapy homework assignments, self-assessment visuals, and crisis intervention resources.
Safety planning tools require special attention to clarity and accessibility. Using PageOn.ai, I can transform complex treatment plans into digestible visual guides that patients can easily reference during challenging moments.
Creating Your Mental Health Infographic Strategy
Planning and Research
Identifying your target audience's specific mental health information needs forms the foundation of effective visual communication. I begin by researching demographic-specific challenges, preferred communication styles, and cultural considerations.
Gathering credible data from sources like ADAA's comprehensive infographic collection ensures accuracy and builds trust with your audience. I also reference WHO reports and NAMI statistics to provide a well-rounded perspective.
Defining clear objectives – whether for awareness, education, or action-oriented goals – guides every design decision. PageOn.ai's Plan-Search-Act process helps structure visual narratives that achieve these objectives efficiently.
Design and Development Process
Selecting appropriate templates and color schemes requires understanding the emotional impact of design choices. I choose calming palettes for anxiety-related content and energizing colors for motivational materials.
Color Psychology in Mental Health Design
Different colors evoke specific emotional responses in mental health contexts:
Incorporating evidence-based infographic data visualizations ensures that visual elements support rather than distract from the message. Testing accessibility features – readable fonts, high contrast, and comprehensive alt text – guarantees inclusivity.
Iterating based on audience feedback and engagement metrics allows continuous improvement. I regularly update designs based on user testing and professional input from mental health practitioners.
Measuring Impact and Continuous Improvement
Key performance indicators for mental health visual content extend beyond traditional engagement metrics. I track not just views and shares, but also meaningful interactions like resource downloads, help-line contacts, and appointment bookings.
Essential Metrics for Mental Health Infographics:
- Engagement rate and time spent viewing content
- Share-to-impression ratio indicating resonance
- Click-through rates to support resources
- Qualitative feedback from mental health professionals
- Behavioral change indicators from follow-up surveys
Gathering feedback from mental health professionals and target audiences provides invaluable insights for refinement. I conduct regular focus groups and surveys to understand how visual materials impact real-world mental health outcomes.
Adapting designs based on evolving mental health research and societal needs keeps content relevant and effective. PageOn.ai's analytics integration helps optimize visual content performance, allowing data-driven improvements to maximize impact.
Future Directions and Innovation
Emerging trends in mental health visualization are pushing boundaries beyond static infographics. I'm exploring AR/VR applications that create immersive therapeutic experiences and interactive infographics that adapt to user responses in real-time.
AI-powered personalization for individual mental health journeys represents the next frontier. Imagine infographics that dynamically adjust based on a user's emotional state, learning preferences, and cultural background – creating truly personalized mental health support.
Integration with telehealth and digital mental health platforms will make visual resources more accessible than ever. Building comprehensive visual mental health resource libraries with PageOn.ai's content blocks enables scalable, consistent communication across multiple touchpoints.
The role of visual communication in preventive mental health care continues to expand. By making mental wellness concepts visually engaging and accessible before crisis points, we can shift from reactive to proactive mental health support – ultimately creating healthier, more resilient communities.
Transform Your Visual Expressions with PageOn.ai
Ready to create mental health infographics that truly make a difference? PageOn.ai's powerful AI-driven tools help you transform complex mental health data into clear, compelling visual stories that educate, inspire, and heal. Join thousands of mental health advocates, educators, and professionals who are revolutionizing how we communicate about mental wellness.
Start Creating with PageOn.ai TodayYou Might Also Like
Transform Your Google Slides: Advanced Techniques for Polished Presentations
Master advanced Google Slides techniques for professional presentations. Learn design fundamentals, visual enhancements, Slide Master, and interactive elements to create stunning slides.
Mastering Visual Flow: How Morph Transitions Transform Presentations | PageOn.ai
Discover how Morph transitions create dynamic, seamless visual connections between slides, enhancing audience engagement and transforming ordinary presentations into memorable experiences.
Maximizing Google Drive Integration for AI-Powered Presentations | PageOn.ai
Discover how to transform your workflow by integrating Google Drive with AI presentation tools like PageOn.ai. Learn advanced techniques for automated, data-rich visual storytelling.
Instant Presentation Intelligence: Transform Complex Slides into Actionable Summaries with AI
Discover how AI transforms presentations into actionable summaries. Learn about top summarization tools, techniques, and workflows to efficiently process complex slide decks.