Pyramid Infographics: Building Visual Hierarchies That Transform Complex Data
Master the Art of Hierarchical Visualization
I've discovered that pyramid infographics are among the most powerful tools for communicating hierarchical information. From my experience creating hundreds of visual presentations, I can tell you that when we need to show relationships, priorities, or progressive concepts, nothing beats the clarity of a well-designed pyramid.
The Power of Pyramid Visualization
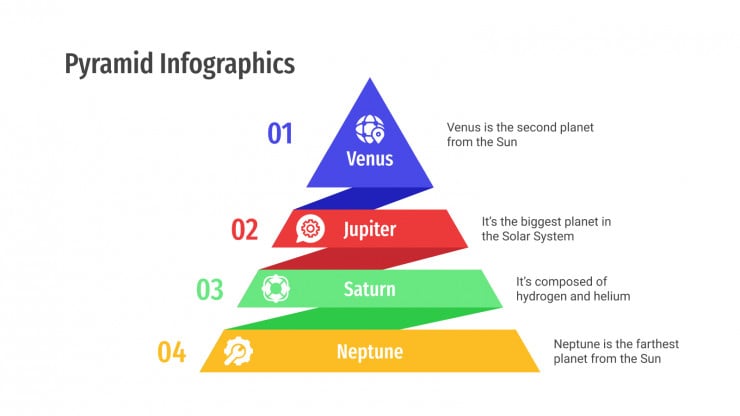
When I first started working with infographic design, I quickly realized that pyramid structures have an almost magical ability to make complex hierarchies instantly understandable. There's something deeply intuitive about how we process information arranged in this triangular format - our brains naturally grasp that wider sections represent broader concepts while narrower portions signify increased specificity or importance.
The psychology behind pyramid infographics fascinates me. We're hardwired to understand both bottom-up and top-down information processing, and pyramids leverage both simultaneously. Whether you're presenting to executives, teaching students, or explaining complex systems to clients, pyramid visualizations create that "aha!" moment of instant comprehension.
What excites me most about modern pyramid creation is how tools like PageOn.ai's AI Blocks have revolutionized the process. Instead of spending hours tweaking designs, I can now build sophisticated pyramid infographics through modular design - assembling pre-designed segments like building blocks to create exactly what I need.
Core Types and Strategic Applications
Through my years of creating visual content, I've identified four primary pyramid types that serve distinct communication purposes. Let me walk you through each one and show you how they transform different kinds of information.
Four Essential Pyramid Types
flowchart TD
                        A[Pyramid Infographic Types] --> B[Hierarchical Pyramids]
                        A --> C[Process Pyramids]
                        A --> D[Priority Pyramids]
                        A --> E[Data-Driven Pyramids]

                        B --> B1[Organizational Structures]
                        B --> B2[Authority Distribution]

                        C --> C1[Sales Funnels]
                        C --> C2[Marketing Engagement]

                        D --> D1["Maslow's Hierarchy"]
                        D --> D2[Financial Planning]

                        E --> E1[Energy Pyramids]
                        E --> E2[Statistical Analysis]

                        style A fill:#FF8000,stroke:#333,stroke-width:2px
                        style B fill:#42A5F5,stroke:#333,stroke-width:2px
                        style C fill:#66BB6A,stroke:#333,stroke-width:2px
                        style D fill:#FFA726,stroke:#333,stroke-width:2px
                        style E fill:#AB47BC,stroke:#333,stroke-width:2px
Hierarchical Pyramids
I use these constantly for organizational structures. They brilliantly visualize corporate hierarchies, showing how authority and responsibility flow from the CEO at the apex down through various management levels to the broader employee base.
Process Pyramids
Perfect for step-by-step progressions. My favorite application is creating sales funnel representations - especially those 5-stage B2B models that show how prospects narrow down from awareness to purchase.
Priority Pyramids
Maslow's Hierarchy remains the gold standard here. I've adapted this concept countless times for financial planning pyramids, showing clients how to prioritize from essential needs to aspirational goals.
Data-Driven Pyramids
These excel at representing statistical relationships. Energy pyramids in ecological systems and trophic level visualizations are classic examples that I've modernized for business contexts.
What I love about PageOn.ai's Deep Search feature is how it integrates relevant data visualization charts directly into pyramid designs, ensuring your hierarchical data is always backed by solid visual evidence.
Design Principles for Maximum Impact
Visual Hierarchy and Structure
In my design process, I've learned that the width-to-importance correlation is absolutely crucial. The narrower tiers at the top naturally draw the eye and signal higher significance - it's a visual language we all instinctively understand.
Effective Color Strategies for Pyramid Tiers

Content Organization Strategies
- → Bottom Tier: I always place general, foundational information here - the broadest concepts that support everything above.
- → Middle Tiers: This is where progressive refinement happens - each level becomes more specific and targeted.
- → Top Tier: Reserved for the most critical or specific data points - the pinnacle of your information hierarchy.
I've found that PageOn.ai's Vibe Creation feature is invaluable here - it transforms complex hierarchical data into conversational, understandable visuals that resonate with any audience. The AI understands context and automatically suggests the most effective organization strategy.
Creating Effective Pyramid Infographics
Planning and Data Preparation
My pyramid creation process always starts with crystal-clear purpose definition. I ask myself: Am I showing hierarchy, process, or weighting? This fundamental decision shapes everything that follows.
My Pyramid Planning Framework
flowchart LR
                        A[Define Purpose] --> B[Determine Tiers]
                        B --> C[Categorize Data]
                        C --> D[Assign Relationships]
                        D --> E[Design Execution]

                        B --> B1[3-8 Levels Optimal]
                        C --> C1[Group Similar Items]
                        D --> D1[Establish Connections]

                        style A fill:#FF8000,stroke:#333,stroke-width:2px
                        style E fill:#66BB6A,stroke:#333,stroke-width:2px
Design Execution Best Practices
Template Selection
I match templates to content type - hierarchical for org charts, funnel-shaped for sales processes, balanced for priority frameworks.
Color Psychology
Warm colors for urgency at the top, cool colors for foundation. I use gradients to show natural progression between levels.
Typography Hierarchy
Font sizes decrease as you move down the pyramid, reinforcing the visual hierarchy through text treatment.
Brand Integration
I incorporate brand elements subtly - maintaining clarity while ensuring the pyramid feels cohesive with overall brand identity.
What revolutionized my workflow was discovering PageOn.ai's AI Blocks - I can build pyramids like LEGOs, combining pre-designed segments fluidly. It's transformed what used to take hours into a matter of minutes.
Industry-Specific Applications and Examples
Business and Marketing
In my consulting work, I've developed pyramid infographics for dozens of business contexts. Sales funnel optimization pyramids are particularly powerful - they visually demonstrate conversion rates at each stage, making bottlenecks immediately apparent.

My Most Effective Business Applications:
- • Customer engagement hierarchy models showing interaction levels
- • Brand pyramid frameworks defining core values to brand promise
- • Strategic priority pyramids for executive decision-making
- • Team structure visualizations for organizational chart online presentations
These pyramids connect beautifully with growth strategies visualization, creating a comprehensive visual language for business transformation.
Education and Training
Pyramid Usage in Educational Contexts
I've seen firsthand how pyramid visualizations transform educational content. When teaching complex concepts like energy transfer in ecosystems or mathematical progressions, pyramids make abstract ideas concrete. PageOn.ai's Agentic processes excel here, transforming educational concepts into polished visual learning tools that students actually enjoy engaging with.
Research and Data Presentation
Research findings often involve complex hierarchies and relationships. I use pyramid infographics to prioritize findings, stratify statistical data, and visualize survey results in ways that make patterns immediately apparent. This approach to creating impactful data visualizations consistently drives better decision-making in research contexts.
Technical Considerations and Tools
Digital Creation Platforms
My toolkit has evolved significantly over the years. While I still use PowerPoint and Google Slides for quick pyramids, and Illustrator for vector-based precision work, the game-changer has been PageOn.ai's voice and text command capabilities.
Traditional Tools
PowerPoint, Illustrator, Photoshop
Time: 2-4 hours per pyramid
Online Generators
Canva, Visme, Template sites
Time: 30-60 minutes
PageOn.ai
Voice/text commands, AI Blocks
Time: 5-15 minutes
Customization and Flexibility
What I love about modern pyramid creation is the flexibility. I regularly create hybrid pyramid-mind map combinations that leverage the strengths of both formats. Inverted pyramids work brilliantly for showing delegation or distribution patterns, while 3D pyramids add that extra visual impact for presentations.
The key is combining pyramid infographics with other elements from your visual toolkit. This creates comprehensive infographic designs that tell complete stories rather than just showing hierarchies in isolation.
Common Pitfalls and How to Avoid Them
Through years of creating and reviewing pyramid infographics, I've identified the most common mistakes that undermine their effectiveness. Let me share these pitfalls and my proven solutions.
❌ Overcrowding Tiers
The most common mistake I see is cramming too much information into each tier.
✓ Solution: Limit each tier to one core concept with 2-3 supporting points maximum.
❌ Inconsistent Tier Sizing
When tier widths don't accurately represent data proportions, it creates confusion.
✓ Solution: Ensure visual proportions match data relationships - use precise measurements.
❌ Poor Color Contrast
Low contrast between tiers makes the pyramid difficult to read and understand.
✓ Solution: Use distinct colors or gradients with clear boundaries between levels.
❌ Missing Context
Pyramids without supporting explanations leave viewers guessing about relationships.
✓ Solution: Include brief annotations or a legend to clarify tier meanings.
❌ Unclear Tier Relationships
Failing to show how tiers connect or progress from one to another.
✓ Solution: Use arrows, connectors, or transitional elements to show flow.
The beauty of using PageOn.ai's structured approach is that it helps avoid these pitfalls automatically. The AI maintains clarity while handling complex information, ensuring your pyramids are both beautiful and functional.
Future Trends and Innovations
The future of pyramid infographics excites me tremendously. We're moving beyond static images into dynamic, interactive experiences that respond to user engagement and update in real-time.
Emerging Pyramid Infographic Technologies
flowchart TD
                        A[Future of Pyramid Infographics] --> B[Interactive Pyramids]
                        A --> C[AR/VR Integration]
                        A --> D[Real-time Data]
                        A --> E[AI Generation]

                        B --> B1[Click-through layers]
                        B --> B2[Hover animations]

                        C --> C1[3D manipulation]
                        C --> C2[Immersive presentations]

                        D --> D1[Live data feeds]
                        D --> D2[Auto-updating tiers]

                        E --> E1[Voice commands]
                        E --> E2[Context-aware design]

                        style A fill:#FF8000,stroke:#333,stroke-width:3px
                        style B fill:#42A5F5,stroke:#333,stroke-width:2px
                        style C fill:#AB47BC,stroke:#333,stroke-width:2px
                        style D fill:#66BB6A,stroke:#333,stroke-width:2px
                        style E fill:#FFA726,stroke:#333,stroke-width:2px
What I'm Most Excited About:
- 🚀 Interactive Pyramids: Click-through layers revealing deeper information, creating multi-dimensional narratives.
- 🚀 AR/VR Visualizations: Imagine walking through a pyramid structure, experiencing data from within.
- 🚀 Real-time Updates: Pyramids that adjust automatically as data changes, perfect for live dashboards.
- 🚀 AI Optimization: Intelligent systems that suggest the best pyramid structure based on your data.
The integration with dynamic organizational tools is particularly promising. Soon, pyramid infographics will seamlessly connect with organizational chart platforms, creating living documents that evolve with your organization. PageOn.ai's continuous evolution ensures we're always at the forefront of these emerging visualization needs, making complex data accessible to everyone.
Transform Your Visual Expressions with PageOn.ai
Ready to create pyramid infographics that captivate and communicate? Join thousands of professionals who've revolutionized their visual storytelling with PageOn.ai's intelligent design tools. From simple hierarchies to complex data visualizations, bring your ideas to life in minutes, not hours.
Start Creating with PageOn.ai TodayYou Might Also Like
Transform Your Presentations: Mastering Slide Enhancements for Maximum Impact
Learn how to elevate your presentations with effective slide enhancements, formatting techniques, and visual communication strategies that captivate audiences and deliver powerful messages.
Crafting Intuitive Interfaces: Applying Gestalt Psychology for Enhanced User Perception
Learn how to apply Gestalt psychology principles to create more intuitive user interfaces. Discover proximity, similarity, figure/ground, and other key principles for better UX design.
The Strategic GIF Guide: Creating Memorable Moments in Professional Presentations
Discover how to effectively use GIFs in professional presentations to create visual impact, enhance audience engagement, and communicate complex concepts more memorably.
Revolutionizing Slide Deck Creation: How AI Tools Transform Presentation Workflows
Discover how AI-driven tools are transforming slide deck creation, saving time, enhancing visual communication, and streamlining collaborative workflows for more impactful presentations.