How Research Rabbit Transforms Academic Literature Discovery Through Visual Connection Mapping
Navigating the Citation Network Revolution in Academic Research
In my journey through academic research, I've witnessed the evolution from manual citation tracking to sophisticated visual mapping tools. Research Rabbit represents a paradigm shift in how we discover, connect, and understand scholarly literature—transforming the overwhelming task of literature review into an intuitive visual exploration.
The Challenge of Modern Literature Discovery
When I first started my research journey, I remember spending countless hours clicking through reference lists, opening dozens of browser tabs, and feeling overwhelmed by the sheer volume of academic publications. Today's researchers face an even greater challenge—with over 2.5 million papers published annually, traditional keyword searches simply aren't enough anymore.
The problem becomes particularly acute when you're new to a field. Without knowing the specific jargon or key authors, Google Scholar can return thousands of irrelevant results. I've watched graduate students struggle with this "vocabulary barrier," missing crucial papers simply because they didn't know the right search terms. Research Rabbit addresses this fundamental challenge by moving beyond keywords to understand the actual connections between papers.
The Rabbit Hole Problem: Research Rabbit gets its name from the common experience of falling down citation "rabbit holes"—starting with one paper, checking its references, then checking those papers' references, and suddenly finding yourself with 50 open tabs and no clear direction. The tool transforms this chaotic process into a structured, visual exploration.
What excites me most is how Research Rabbit integrates with modern visualization tools. By combining its citation networks with PageOn.ai's Deep Search capabilities, researchers can now create comprehensive visual narratives that go beyond simple network diagrams. This integration allows us to transform complex citation data into clear, compelling visual stories that communicate research landscapes effectively.
Understanding Research Rabbit's Core Architecture
At its heart, Research Rabbit employs a sophisticated citation-based discovery engine that analyzes approximately 50,000 papers to identify the strongest connections to your research topic. This isn't just about counting citations—the algorithm considers multiple factors including co-citations, bibliographic coupling, and temporal relationships to surface truly relevant papers.
Research Rabbit's Data Architecture
flowchart TD
                        A[Seed Papers Input] --> B[Citation Analysis Engine]
                        B --> C[Microsoft Academic Graph]
                        B --> D[Semantic Scholar]
                        B --> E[PubMed Database]
                        C --> F[Network Generation]
                        D --> F
                        E --> F
                        F --> G[Visual Mapping]
                        F --> H[Recommendations]
                        G --> I[Interactive Network View]
                        G --> J[Timeline View]
                        H --> K[Similar Papers]
                        H --> L[Author Networks]
                        style A fill:#FF8000,color:#fff
                        style G fill:#42A5F5,color:#fff
                        style I fill:#66BB6A,color:#fff
                        style J fill:#66BB6A,color:#fff
The tool draws from multiple prestigious data sources. According to recent analysis, Research Rabbit leverages Microsoft Academic Graph (though this is being phased out), Semantic Scholar's extensive database, and PubMed's biomedical literature collection. This multi-source approach ensures comprehensive coverage across disciplines.
Collection-Based Approach
Unlike tools that analyze single papers, Research Rabbit's collection system allows you to start with multiple seed papers, creating a more nuanced understanding of your research area. I've found this particularly powerful when exploring interdisciplinary topics where a single paper can't capture the full scope.
Visualization Integration
The real magic happens when you transform Research Rabbit's network data into clear visual narratives. Using PageOn.ai's AI Blocks, complex citation networks become intuitive visual stories that colleagues and students can immediately understand.
What sets Research Rabbit apart is its ability to process vast amounts of bibliographic data instantly. When you add a paper to your collection, the system immediately analyzes its entire citation network, identifying patterns and connections that would take weeks to discover manually. This computational power, combined with intelligent visualization, transforms literature discovery from a tedious task into an engaging exploration.
The Visual Mapping Revolution: Networks and Timelines
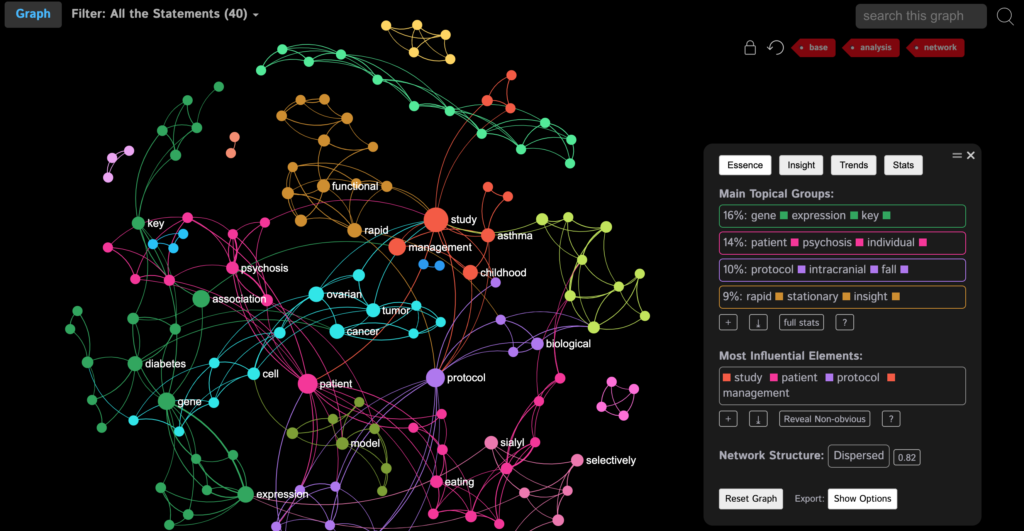
Network Visualization Features
The moment I first saw Research Rabbit's network visualization, I knew this was something special. The green and blue node system instantly communicates which papers are in your collection (green) and which are potential additions (blue). This simple color coding transforms an overwhelming citation network into an intuitive map of your research landscape.
Citation Network Visualization Logic
The interactive citation pathways reveal relationships that aren't immediately obvious. I've discovered that papers appearing as bridges between clusters often represent interdisciplinary work or methodological innovations that connect different research communities. The darker shading for recent publications helps identify emerging trends at a glance.

Timeline View Capabilities
The timeline view has become my favorite feature for understanding research evolution. By plotting papers chronologically while maintaining their citation relationships, you can literally see how ideas develop over time. I recently used this to track the evolution of AI tools for literature reviews, watching the field explode from a handful of papers in 2018 to hundreds by 2023.
Research Surge Identification: The timeline view revealed that AI research in my field surged dramatically in 2023, coinciding with ChatGPT's release. This visualization helped me identify not just the increase in volume, but also the shift in research focus from theoretical frameworks to practical applications.
What makes these visualizations truly powerful is their potential for enhancement. By integrating Research Rabbit's network data with PageOn.ai's Vibe Creation tools, we can transform complex citation networks into compelling visual narratives. Imagine presenting your literature review not as a list of papers, but as an interactive journey through the evolution of ideas in your field.
Advanced Discovery Methods and Workflow Integration
Three-Pillar Discovery System
Research Rabbit's discovery system rests on three pillars that I've come to rely on for comprehensive literature exploration. Each serves a distinct purpose in building a complete picture of your research landscape.
Similar Work
Uses topic-similarity algorithms to find conceptually related papers. While the exact algorithm remains opaque, I've found it consistently surfaces papers using different terminology for similar concepts—invaluable for interdisciplinary research.
Earlier/Later Work
Citation-based temporal exploration reveals the intellectual lineage of ideas. Earlier work helps identify foundational papers, while later work shows how concepts have evolved and been applied.
Author Networks
Co-authorship graphs reveal research communities and collaboration patterns. I've discovered entire research groups working on my topic that I wouldn't have found through keyword searches.
The beauty of this system is how it mirrors natural research workflows. When I find an interesting paper, I instinctively want to know: What similar work exists? What came before and after? Who are the key researchers? Research Rabbit answers all these questions with a single click, then visualizes the results instantly.
The Column-Based Interface Innovation
Cascading Discovery Workflow
flowchart LR
                        A[Seed Paper] --> B[Similar Work Column]
                        B --> C[Select Paper]
                        C --> D[References Column]
                        D --> E[Select Reference]
                        E --> F[Author Publications]
                        F --> G[Build Collection]
                        style A fill:#FF8000,color:#fff
                        style G fill:#66BB6A,color:#fff
The cascading column interface represents a breakthrough in research navigation. As I click through papers, each action spawns a new column to the right, creating a visual breadcrumb trail of my exploration. This design brilliantly solves the problem of getting lost in citation networks—you always know exactly how you arrived at a particular paper.
Speed and Flow State
The split-second generation of results keeps me in a flow state. There's no waiting for pages to load or databases to query. Click on "All Citations" and boom—the results appear instantly with an automatic visualization. This speed transforms literature discovery from a chore into an engaging exploration. When presenting findings, I use PageOn.ai's drag-and-drop blocks to recreate this cascading discovery process visually, helping others understand my research journey.
While the automatic visualization panel activation initially surprised me, I've grown to appreciate the confidence behind this design choice. The developers clearly believe their visualizations add value—and they're right. The instant visual feedback helps me understand relationships between papers far more quickly than scanning through lists.
Practical Implementation: From Discovery to Documentation
Building Effective Collections
After years of using Research Rabbit, I've developed a systematic approach to building collections that maximizes discovery while maintaining focus. The key is starting with the right seed papers—typically 2-3 foundational works that represent different aspects of your research question.

My Collection Strategy:
- Start with one highly-cited review paper for breadth
- Add one recent breakthrough paper for currency
- Include one methodological paper if relevant to your approach
- Create separate collections for each research question or chapter
- Use categories to organize collections by project or publication
Category organization becomes crucial as your research expands. I maintain separate categories for each manuscript I'm working on, plus a "Exploration" category for serendipitous discoveries. This structure prevents the overwhelming feeling that comes from having dozens of unorganized collections.
Integration with Reference Management
The Zotero synchronization feature has transformed my workflow. Previously, I'd spend hours manually importing papers from various sources. Now, Research Rabbit automatically syncs discoveries to my Zotero library, complete with metadata and organized into collections that mirror my Research Rabbit structure.
Reference Management Integration Flow
flowchart LR
                        A[Research Rabbit Collection] --> B[Two-way Sync]
                        B --> C[Zotero Library]
                        C --> D[BibTeX Export]
                        C --> E[RIS Export]
                        C --> F[Word Plugin]
                        D --> G[LaTeX Document]
                        E --> H[EndNote]
                        F --> I[Manuscript]
                        style A fill:#FF8000,color:#fff
                        style C fill:#42A5F5,color:#fff
Real-time collaboration has become increasingly important in my research. Research Rabbit's collection sharing feature allows me to work seamlessly with international collaborators. We can add papers, leave comments, and track changes together, regardless of location. When it's time to present our findings, I transform these shared collections into visual maps using PageOn.ai, creating compelling narratives that showcase our research journey.
Export Capabilities
BibTeX and RIS formats ensure compatibility with any reference manager. I particularly appreciate how Research Rabbit preserves collection structure during export, maintaining the organizational work you've already done.
Visual Documentation
Beyond traditional citations, I use PageOn.ai to create visual citation maps from my Research Rabbit collections. These visual representations make literature reviews more engaging and help readers understand the relationships between sources.
Comparative Analysis: Research Rabbit in the Tool Ecosystem
Research Rabbit vs. Connected Papers
Having extensively used both tools, I can definitively say they serve different purposes. Connected Papers excels at quick, one-shot explorations when you have a single paper and want to see its immediate network. Research Rabbit, however, is built for sustained research projects where you're building comprehensive bibliographies.
Tool Comparison: Features and Capabilities
| Feature | Research Rabbit | Connected Papers |
|---|---|---|
| Starting Point | Multiple seed papers (collections) | Single paper only |
| Cost | Free unlimited | 5 graphs/month free, then $3/month |
| Visualization | Interactive, customizable | Static, similarity-based layout |
| Best For | Comprehensive literature reviews | Quick paper exploration |
Research Rabbit vs. Litmaps
The Litmaps comparison is more nuanced. According to comprehensive testing, Litmaps offers a unique 2D layout where papers are positioned by citation count (vertical) and publication date (horizontal). This creates an intuitive "importance map" where significant recent papers naturally cluster in the top-right corner.
Key Differentiators:
- Research Rabbit: Shows thousands of results, free forever, better for exhaustive searches
- Litmaps: Curated 10-paper batches, $10/month, superior visual design and user experience
My recommendation? Use Research Rabbit for comprehensive discovery and Litmaps when you need polished visualizations for presentations. For creating custom visual comparisons of these tools' features, PageOn.ai's structured blocks provide the perfect solution, allowing you to build clear, professional comparison matrices that help teams make informed decisions.
Strategic Applications Across Academic Workflows
Literature Review Enhancement
Research Rabbit has fundamentally changed how I approach literature reviews. Instead of the traditional keyword-based search followed by manual citation chasing, I now begin with a strategic selection of seed papers and let the tool reveal the hidden structure of my field. This approach has consistently uncovered "citation islands"—disconnected research communities working on similar problems with different terminology.
Discovering Beyond Keywords
In my recent review on AI research tools for literature review, Research Rabbit found papers using terms like "automated systematic review" and "machine-assisted synthesis" that my keyword searches completely missed.
Gap Identification
The network visualization reveals research gaps as literal empty spaces in the citation network. I've identified three potential research questions simply by noticing disconnected clusters that should logically be connected.
Building comprehensive bibliographies has become almost effortless. Starting with just 3-5 key papers, I can generate a thorough bibliography of 50-100 relevant sources in under an hour. The tool's ability to rank papers by various metrics (citations, recency, relevance) helps prioritize reading, ensuring I focus on the most impactful work first.
Research Monitoring and Alerts
The alert system has become my secret weapon for staying current. I maintain collections for each of my active research areas, and Research Rabbit sends weekly emails highlighting new papers that match my interests. This passive monitoring ensures I never miss important developments in my field.
Research Monitoring Workflow
flowchart TD
                        A[Create Topic Collection] --> B[Enable Email Alerts]
                        B --> C[Weekly Analysis]
                        C --> D{New Papers Found?}
                        D -->|Yes| E[Email Notification]
                        D -->|No| F[Continue Monitoring]
                        E --> G[Review Papers]
                        G --> H[Add to Collection]
                        H --> I[Update Research]
                        F --> C
                        style A fill:#FF8000,color:#fff
                        style E fill:#66BB6A,color:#fff
Author tracking provides another dimension to research monitoring. By following key researchers in my field, I'm notified whenever they publish new work. This has led to several collaborative opportunities—reaching out to authors whose recent work aligns with mine has resulted in two co-authored papers and numerous valuable discussions.
Pro Tip: Create a "Competitors and Collaborators" collection containing papers from research groups working on similar problems. The alert system will notify you of their new publications, keeping you informed about parallel developments in your field. Transform these competitive intelligence insights into visual dashboards using PageOn.ai's Agentic features for team presentations.
Maximizing Research Rabbit's Potential
Best Practices and Tips
Through extensive use and experimentation, I've developed strategies that maximize Research Rabbit's effectiveness. The most crucial insight: your seed paper selection determines everything. Choose papers that are too narrow, and you'll miss important adjacent work. Too broad, and you'll be overwhelmed with tangentially related papers.
The 3-Cut Technique for Paper Prioritization
- First Cut: Sort by citations—identify the most influential papers in your field
- Second Cut: Filter by recency—find papers published in the last 2-3 years
- Third Cut: Review abstracts—quickly scan for methodological or theoretical relevance
This technique, which I learned from productivity research, helps manage the overwhelming volume of suggestions Research Rabbit generates.
Abstract previews have saved me countless hours. Instead of downloading and skimming full papers, I can quickly assess relevance from the abstract popup. I've trained myself to make decisions in 30 seconds: relevant papers go into the collection, maybes get tagged for later review, and irrelevant papers are ignored.
Seed Paper Selection Strategy
Common Pitfalls and Solutions
The most common mistake I see researchers make is trying to process too many papers at once. Research Rabbit can easily generate thousands of suggestions, leading to paralysis. My solution: work in focused sprints. Set a timer for 25 minutes and aim to review 20-30 papers. Take a break, then repeat. This maintains focus and prevents burnout.
Common Pitfall
Algorithm Opacity: Not understanding why certain papers are recommended can lead to missing important context or including irrelevant papers.
Solution: Always verify recommendations by checking citation counts, journal quality, and reading abstracts carefully.
Common Pitfall
Interface Overwhelm: The cascading column interface can become confusing after multiple exploration branches.
Solution: Regularly return to your main collection view. Use the "fit all" button to regain perspective on your exploration path.
Documentation has become crucial for managing complex research projects. I create visual guides and tutorials using PageOn.ai, transforming my Research Rabbit workflows into clear, shareable instructions. This not only helps my research team but also serves as a reference when I return to a project after months away.
Future Implications and Evolving Capabilities
The landscape of academic discovery tools is rapidly evolving, and Research Rabbit sits at an interesting inflection point. The discontinuation of Microsoft Academic Graph in 2021 initially raised concerns about data availability, but the tool has successfully transitioned to alternative sources, demonstrating remarkable resilience.
The integration of semantic search features represents a significant evolution. While Research Rabbit has traditionally excelled at citation-based discovery, adding AI-powered semantic analysis could address one of its few limitations: finding conceptually related papers that aren't citation-connected. Early experiments with this feature show promise, though it currently lacks the speed and relevance of the core citation-based system.
Emerging Capabilities on the Horizon
- AI-enhanced recommendation algorithms that learn from user behavior
- Integration with text diffusion models for automated summary generation
- Cross-database searching beyond current sources
- Real-time collaboration features with version control
- Mobile applications for research on the go
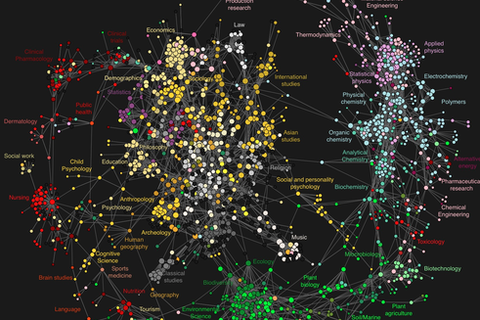
The role of visual tools in making complex citation networks accessible cannot be overstated. As research becomes increasingly interdisciplinary, tools that can visualize connections across fields become essential. I envision a future where Research Rabbit's network data seamlessly integrates with presentation tools like PageOn.ai, allowing researchers to create interactive, visual narratives that make complex research landscapes accessible to diverse audiences.
Evolution of Literature Discovery Tools
Perhaps most exciting is the democratization of research access. By remaining free and continuously improving, Research Rabbit ensures that researchers worldwide, regardless of institutional resources, can access powerful discovery tools. This commitment to accessibility, combined with evolving capabilities, positions Research Rabbit as a cornerstone tool for the next generation of researchers.
Looking Ahead: The convergence of citation-based discovery, AI-powered semantic search, and visual communication tools like PageOn.ai promises a future where literature discovery isn't just efficient—it's intuitive, engaging, and accessible to researchers at all levels. The challenge will be maintaining the human element of critical thinking while leveraging these powerful automated tools.
Transform Your Visual Expressions with PageOn.ai
Take your research visualization to the next level. PageOn.ai helps you transform complex citation networks and research findings into stunning visual narratives that captivate and inform your audience. From literature reviews to research presentations, make your academic work visually compelling and accessible.
Start Creating with PageOn.ai TodayEmbracing the Visual Research Revolution
Research Rabbit has fundamentally transformed how I approach academic literature discovery. What once took weeks of manual searching and citation chasing now happens in hours, with better results and deeper insights. The tool's visual approach doesn't just make research faster—it makes it more intuitive and enjoyable.
As we move forward, the integration of tools like Research Rabbit with visual communication platforms like PageOn.ai opens unprecedented opportunities. We can now not only discover research more efficiently but also communicate our findings more effectively. The ability to write literature reviews for research papers that are both comprehensive and visually engaging represents a new standard in academic communication.
My advice to fellow researchers: embrace these tools not as replacements for critical thinking, but as amplifiers of your research capabilities. Use Research Rabbit to explore broadly and deeply, then use visual tools to share your discoveries in ways that inspire and inform. The future of research isn't just about finding more papers—it's about understanding connections, identifying patterns, and communicating insights in ways that advance human knowledge.
"The best research tools don't just help us find information—they help us see the invisible threads that connect ideas across time, disciplines, and cultures. Research Rabbit does exactly that."
You Might Also Like
Mastering Element Alignment for Professional Learning Layouts | Visual Design Guide
Learn how to create visually engaging professional learning materials through strategic element alignment techniques that enhance information retention and learner engagement.
Bringing Google Slides to Life with Dynamic Animations | Complete Guide
Transform static presentations into engaging visual stories with our comprehensive guide to Google Slides animations. Learn essential techniques, advanced storytelling, and practical applications.
The Strategic GIF Guide: Creating Memorable Moments in Professional Presentations
Discover how to effectively use GIFs in professional presentations to create visual impact, enhance audience engagement, and communicate complex concepts more memorably.
The Critical Human Element: Mastering AI Tool Selection for Impactful Presentations
Discover how to leverage human judgment when selecting AI presentation tools. Learn to balance automation with creativity for truly impactful, connection-driven presentations.