Transform Your Roadmap Vision into Dynamic Visual Journeys
I've discovered that roadmap infographics are more than just timelines—they're strategic communication tools that transform complex planning into captivating visual narratives. Let me share how modern AI-powered visualization is revolutionizing the way we create and share our strategic visions.
The Power of Visual Roadmapping in Modern Communication
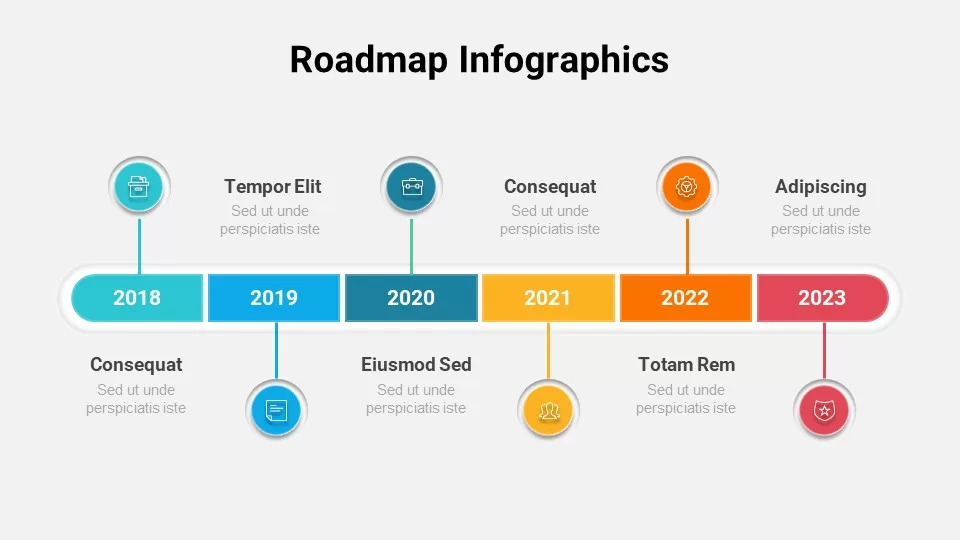
When I first encountered roadmap infographics, I realized they were far more than simple project timelines. These visual representations of overarching goals and high-level tasks have evolved from static charts into dynamic, interactive designs that incorporate icons, color coding, and even multimedia elements. They've become essential tools for visualizing strategies, development timelines, and project phases across every industry imaginable.
Why Traditional Roadmaps Fail to Engage
I've witnessed countless traditional roadmaps fail to capture stakeholder attention. The problems are consistent: overwhelming text-heavy formats that lose audience focus within minutes, lack of visual hierarchy that makes priorities unclear, and static presentations that don't adapt to different viewing contexts. These failures aren't just aesthetic—they directly impact project alignment and decision-making speed.
My Discovery: When I started using PageOn.ai's Vibe Creation feature, I found I could transform verbal descriptions into structured visual roadmaps through conversational AI. This approach bypasses complex software learning curves while maintaining professional quality, allowing me to create roadmaps that tell compelling stories, not just display timelines.
The Evolution of Roadmap Design
flowchart LR
                        A[Text Lists] --> B[Static Charts]
                        B --> C[Interactive Timelines]
                        C --> D[AI-Powered Visuals]
                        D --> E[Dynamic Roadmaps]

                        style A fill:#f3f4f6
                        style B fill:#fef3c7
                        style C fill:#fed7aa
                        style D fill:#fdba74
                        style E fill:#FF8000
Building Roadmap Architecture with AI-Powered Blocks
I've learned that effective roadmap infographics require careful architectural planning. The essential components include various timeline structures—linear for straightforward progressions, circular for cyclical processes, milestone-based for achievement-focused projects, and branching formats for complex decision trees. Each structure serves a unique communication purpose.
Visual Elements I Always Include
- • Progress indicators showing completion percentages
- • Phase markers with clear start/end points
- • Dependency connections between related tasks
- • Risk indicators for potential roadblocks
PageOn.ai's Modular Approach
- • Combine blocks like building with LEGOs
- • Drag-and-drop for rapid iteration
- • Smart layout suggestions based on content
- • Multi-dimensional stakeholder views
What excites me most about modern roadmap creation is the ability to create multi-dimensional views for different stakeholders. I can craft executive-level strategic overviews highlighting key milestones, team-level detailed task breakdowns showing dependencies, and client-facing progress visualizations celebrating achievements. This flexibility, combined with insights from infographic planning strategies, transforms roadmaps into powerful communication tools.
Data Integration and Visual Enhancement Strategies
I've discovered that incorporating real-time data and metrics transforms static roadmaps into living documents. By integrating progress tracking with automatic percentage calculations, budget allocation visualizations alongside timeline elements, and resource utilization heat maps overlaying project phases, my roadmaps become comprehensive project dashboards.
Resource Allocation Across Project Phases
Leveraging AI for Contextual Enhancement
Using PageOn.ai's Deep Search capability has revolutionized how I enhance my roadmaps. The AI automatically sources relevant icons and visual metaphors—mountain peaks for achievements, road imagery for journeys—that resonate with my target audience. It pulls in industry-specific visuals and integrates data visualizations from company reports, creating cohesive, professional presentations. The principles I've learned from data visualization charts ensure clarity in every element.
Color Psychology in My Roadmap Design
- 🎨 Strategic color coding for different workstreams
- ✨ Contrast techniques highlighting critical paths
- ♿ Accessibility with clear visual distinctions
- 🎯 Emotional triggers through color selection
Industry-Specific Roadmap Applications and Templates
Through my experience creating roadmaps across various industries, I've developed specialized approaches for different sectors. Each industry has unique requirements and visual languages that resonate with their stakeholders.
Technology and Product Development
In software development, I create lifecycle visualizations that showcase sprint planning roadmaps with iterative cycles, feature release timelines with dependency mapping, and technical debt reduction pathways. For product launches, I design go-to-market strategy timelines, multi-channel marketing campaign coordination maps, and post-launch iteration planning visuals.

Business Strategy and Operations
For business strategy, I focus on annual planning visualizations with quarterly objectives, OKR alignment charts, and department-specific contribution mapping. Change management roadmaps require special attention to organizational restructuring phases, digital transformation milestones, and culture evolution journey maps.
flowchart TD
                            A[Strategic Vision] --> B[Q1 Objectives]
                            A --> C[Q2 Objectives]
                            A --> D[Q3 Objectives]
                            A --> E[Q4 Objectives]

                            B --> F[Marketing OKRs]
                            B --> G[Product OKRs]
                            C --> H[Sales OKRs]
                            C --> I[Operations OKRs]

                            style A fill:#FF8000
                            style B fill:#fed7aa
                            style C fill:#fed7aa
                            style D fill:#fed7aa
                            style E fill:#fed7aa
Marketing and Creative Campaigns
Marketing roadmaps demand creative flair. I design content calendar roadmaps with editorial planning themes, multi-platform publication schedules, and campaign performance checkpoints. Event planning timelines showcase pre-event preparation phases, day-of execution schedules, and post-event follow-up sequences that keep teams aligned and audiences engaged.
Interactive and Adaptive Roadmap Features
Creating responsive roadmaps that adapt to viewer needs has become my specialty. I implement expandable sections for detailed information, hover states revealing additional context, and mobile-optimized layouts for on-the-go viewing. These features transform static documents into interactive experiences.
Auto-Updates
Progress reports generated automatically
Smart Adjustments
Timeline suggestions based on actual progress
Multiple Versions
Different views from single data source
PageOn.ai's Agentic capabilities have revolutionized how I handle dynamic updates. The platform auto-generates progress reports based on milestone completion, suggests timeline adjustments comparing actual versus planned progress, and creates multiple roadmap versions from a single data source. This automation, combined with techniques from infographic data visualizations, ensures my roadmaps remain current and relevant.
Building Evolving Roadmaps
My roadmaps now include:
- ✅ Version control for historical tracking
- ✅ Scenario planning with alternative pathways
- ✅ Risk visualization and contingency planning
- ✅ Real-time collaboration features
Stakeholder Engagement Through Visual Storytelling
I've learned that crafting narrative-driven roadmaps that inspire action requires a three-act structure. I begin with the vision—where we're going and why it matters. The middle journey showcases challenges, milestones, and victories. The destination focuses on tangible outcomes and benefits that resonate with stakeholders.

Personalization Through AI
Using PageOn.ai, I personalize roadmap presentations for different audiences. The platform helps me adjust emphasis and detail levels based on viewer needs, incorporate cultural and industry-appropriate visual metaphors, and seamlessly integrate company branding and visual identity. This personalization dramatically increases engagement and buy-in.
Facilitating Collaborative Development
Real-Time Sessions
Co-create with stakeholders live
Visual Feedback
Integrate annotations directly
Consensus Building
Shared visual understanding
Measuring Impact and Optimizing Roadmap Effectiveness
I track key metrics to ensure my roadmap communications succeed. These include stakeholder engagement and comprehension rates, decision-making speed improvements, and reductions in project misalignment and miscommunication. The data consistently shows that visual roadmaps outperform traditional text-based plans.
Roadmap Effectiveness Metrics
A/B Testing Strategies
I continuously test different roadmap visualizations to optimize effectiveness. This includes format variations (timeline vs. Gantt vs. Kanban styles), detail levels (high-level vs. comprehensive views), and visual styles (minimalist vs. rich imagery approaches). The insights gained from economic forecasts visual scenarios help me handle complex planning scenarios.
PageOn.ai Analytics Insights
The platform's analytics reveal which roadmap sections receive the most attention, identify confusion points through user interaction data, and enable iterative design improvements based on effectiveness metrics. This data-driven approach ensures continuous improvement.
Future-Proofing Your Roadmap Strategy
I'm excited about emerging trends in roadmap visualization. AR/VR integration promises immersive planning experiences, AI-powered predictive timeline adjustments will revolutionize project management, and real-time collaboration in virtual spaces will transform how distributed teams work together.
The Future of Roadmap Visualization
flowchart TD
                        A[Current State] --> B[AI Integration]
                        B --> C[AR/VR Experiences]
                        C --> D[Predictive Analytics]
                        D --> E[Autonomous Roadmaps]

                        B -.-> F[Real-time Data]
                        C -.-> G[Immersive Planning]
                        D -.-> H[Smart Adjustments]
                        E -.-> I[Self-Optimizing]

                        style A fill:#e5e7eb
                        style B fill:#fef3c7
                        style C fill:#ddd6fe
                        style D fill:#bfdbfe
                        style E fill:#FF8000
Building Scalable Systems
With PageOn.ai, I'm building scalable roadmap systems that include template libraries for consistent organizational communication, automated roadmap generation from project management tools, and cross-functional roadmap integration with dependency tracking. Understanding fundamental infographic principles ensures long-term success.
Creating a Culture of Visual Planning
- 📚 Training teams in visual thinking principles
- 📋 Establishing standards for roadmap visualization
- 🎉 Celebrating wins in visual communication
- 🔄 Continuous improvement through feedback loops

Transform Your Visual Expressions with PageOn.ai
Ready to revolutionize how you create and share roadmap infographics? Join me in exploring the power of AI-driven visualization tools that transform complex timelines into compelling visual narratives. Your strategic vision deserves to be seen, understood, and acted upon.
Start Creating with PageOn.ai TodayYou Might Also Like
Mastering Animation Timing: Essential Techniques for Dynamic Presentation Slides
Learn essential animation timing techniques for creating dynamic presentation slides. Master entrance, exit, and transition timing for PowerPoint and Google Slides to enhance your visual storytelling.
Crafting Intuitive Interfaces: Applying Gestalt Psychology for Enhanced User Perception
Learn how to apply Gestalt psychology principles to create more intuitive user interfaces. Discover proximity, similarity, figure/ground, and other key principles for better UX design.
Balancing Unity and Variety in Digital Product Design: Creating Harmonious User Experiences
Discover how to achieve the perfect balance between unity and variety in digital product design to create visually appealing, engaging user experiences that drive product success.
Stock Photos in Presentations: Bringing Vibrancy and Depth to Visual Storytelling
Discover how to transform your presentations with strategic stock photography. Learn selection techniques, design integration, and visual consistency to create compelling visual narratives.