Mastering Visual Studio Report Designer
A Comprehensive Guide to Creating Powerful, Data-Driven Visuals
Visual Studio Report Designer is a powerful tool for creating platform-independent reports with rich export capabilities. In this comprehensive guide, I'll walk you through everything from setup to advanced techniques, helping you transform complex data into clear, compelling visualizations.
Understanding the Visual Studio Report Designer Landscape
Visual Studio Report Designer enables developers to create platform-independent reports with powerful export capabilities to formats like PDF, XLSX, and more. The landscape includes several technologies, each with its own strengths and limitations.

Report Designer Technologies Comparison
Available Report Designer Technologies
- Microsoft RDLC Report Designer - Available as an extension for Visual Studio 2019 and later from the Visual Studio Marketplace
- DevExpress Report Designer - Compatible with .NET/.NET Core or .NET Framework projects, installed via the DevExpress Unified Component Installer
- Telerik Reporting's Visual Studio Report Designer - Dedicated to editing CLR/type report definitions in CS or VB files
Key Limitation: Some designers like Telerik's are only available under .NET Framework due to technical constraints. They utilize Visual Studio services that aren't available for newer .NET versions.
All report designers typically integrate directly with Visual Studio's interface, extending its functionality with specialized toolbars, windows, and design surfaces tailored for report creation.
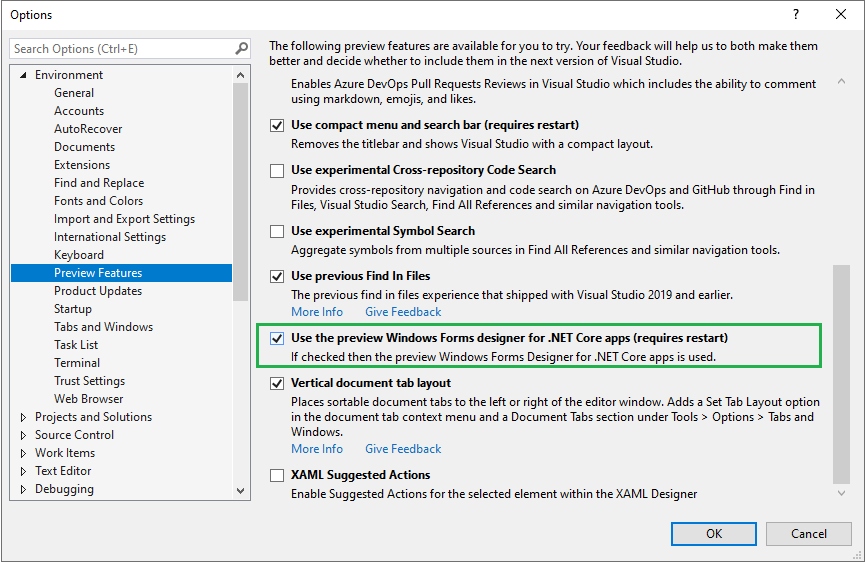
Setting Up Your Visual Studio Report Designer Environment
Before you can start creating reports, you'll need to properly set up your development environment. The installation process varies depending on which report designer technology you choose to work with.
Installation Process Flow
flowchart TD
    A[Start Installation] --> B{Choose Report Designer}
    B -->|Microsoft RDLC| C[Download from VS Marketplace]
    B -->|DevExpress| D[Use DevExpress Unified Component Installer]
    B -->|Telerik| E[Install Telerik Reporting Package]
    C --> F[Install Extension in Visual Studio]
    D --> G[Run Installer & Select Components]
    E --> H[Install Package & Configure VS Integration]
    F --> I[Verify Installation]
    G --> I
    H --> I
    I --> J[Create New Report Project]
Installation Methods by Technology
| Report Designer | Installation Method | Requirements |
|---|---|---|
| Microsoft RDLC | Download from Visual Studio Marketplace | Visual Studio 2019 or later |
| DevExpress | DevExpress Unified Component Installer | Compatible with .NET/.NET Core or .NET Framework |
| Telerik | Included with Telerik Reporting installation | Only available for .NET Framework projects |
Environment Requirements
- Compatible Visual Studio version (typically 2019 or later)
- Required extensions and dependencies (varies by technology)
- Appropriate .NET SDK versions installed
Project Compatibility Considerations
When setting up your environment, it's important to consider project compatibility factors:
- Some designers work only with specific project types (Windows Forms, ASP.NET)
- Report serialization mechanisms differ between technologies
- Not all designers support the latest .NET versions
For example, while DevExpress Report Designer supports both .NET Framework and .NET Core projects, Telerik's Visual Studio Report Designer is limited to .NET Framework due to its reliance on specific Visual Studio services not available in newer .NET versions.
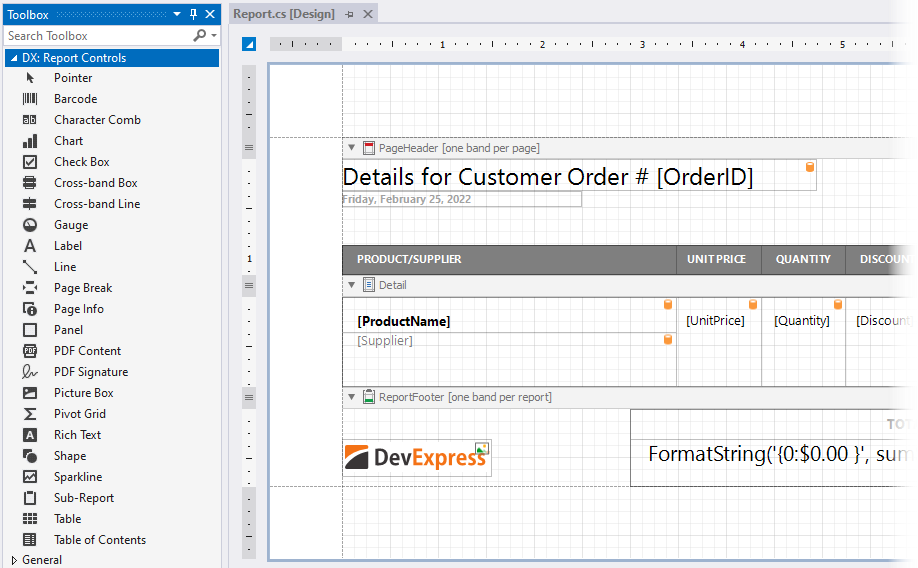
Core Components of the Visual Studio Report Designer Interface
The Visual Studio Report Designer provides a rich set of tools and panels that work together to help you create sophisticated reports. Understanding these core components is essential for efficient report design.
Report Designer Interface Components
flowchart TB
    VS[Visual Studio IDE] --> RD[Report Designer]
    RD --> DS[Design Surface]
    RD --> TB[Toolbox]
    RD --> PE[Properties Explorer]
    RD --> RE[Report Explorer]
    RD --> DE[Data Explorer]
    RD --> GE[Group Explorer]
    RD --> CT[Component Tray]

    DS -->|Contains| RS[Report Sections]
    RS -->|Types| HD[Headers/Footers]
    RS -->|Types| DT[Detail Section]
    RS -->|Types| GP[Group Sections]

    TB -->|Provides| RC[Report Controls]
    RC -->|Types| TC[Text Controls]
    RC -->|Types| DC[Data Controls]
    RC -->|Types| VC[Visual Controls]

    DE -->|Manages| DSR[Data Sources]
    DSR --> QRY[Queries]
    DSR --> PRM[Parameters]
Design Surface
The primary workspace where you visually arrange and configure report elements. This is where you'll spend most of your time creating your report layout.
Properties Explorer
Allows you to customize the appearance and behavior of selected report elements through an extensive set of properties.
Report Explorer
Provides a hierarchical view of all elements in your report, making it easier to select and manage nested components.
Data Explorer
Manages data sources and dataset connections, allowing you to define the data that will populate your report.
Group Explorer
Controls report grouping functionality, essential for organizing data into meaningful sections.
Component Tray
Displays DataSource components used in the report, providing a central location to manage data connections.
Report Sections
Reports are organized into distinct sections, each serving a specific purpose:
- Report Header/Footer - Appears once at the beginning/end of the report
- Page Header/Footer - Repeats at the top/bottom of each page
- Detail Section - Contains the main content, repeating for each record
- Group Header/Footer - Appears at the start/end of each data group
Each section can be resized by dragging the sizing grips at the bottom/right. Most sections except the detail can be deleted by selecting the section and hitting the delete key. To delete a group section, you need to delete the whole group from the Group Explorer.
Creating Your First Report with Visual Studio Report Designer
Now that you understand the components of the Report Designer, let's walk through the process of creating your first report. I'll guide you through each step, from project setup to final preview.
Report Creation Workflow
flowchart TD
    A[Start New Report Project] --> B[Add Data Source]
    B --> C[Create Dataset]
    C --> D[Design Report Layout]
    D --> E[Configure Report Properties]
    E --> F[Preview Report]
    F -->|Issues Found| D
    F -->|No Issues| G[Export/Deploy]

    D --> D1[Add Report Sections]
    D --> D2[Place Controls]
    D --> D3[Configure Grouping]
    D --> D4[Add Formatting]
Starting a New Report Project
- Open Visual Studio and select "File" > "New" > "Project"
- Search for "report" in the template search box
- Select the appropriate report project template (varies by report designer technology)
- Configure the project name and location
- Click "Create" to generate the project
Adding Data Sources
Every report needs data to display. Here's how to connect your report to a data source:
- Right-click on the report design surface or use the Data Explorer panel
- Select "Add Data Source" or equivalent option
- Choose the data source type (database, object, service, etc.)
- Configure connection parameters
- Create a dataset by writing a query or selecting tables/views
- Define parameters if needed for dynamic data filtering
Common Data Source Types
Designing the Report Layout
With your data source configured, you can now design the visual layout of your report:
- Drag and drop controls from the Toolbox onto the design surface
- Common controls include Tables, Textboxes, Images, and Charts
- Bind controls to data fields by setting their data properties
- Organize content into appropriate report sections
- Configure grouping and sorting through the Group Explorer

Previewing and Testing
Before finalizing your report, it's essential to preview and test it:
- Click the "Preview" tab or button in the Report Designer
- Enter parameter values if your report requires them
- Check that data displays correctly and formatting appears as expected
- Test different page sizes and orientations
- Verify that grouping, sorting, and calculations work properly
Tip: Always test your report with different data scenarios, including edge cases like empty datasets or extremely large values, to ensure it handles all situations gracefully.
Once you're satisfied with the preview, you can move on to deployment or export your report to various formats.
Advanced Report Design Techniques
After mastering the basics, you can leverage advanced techniques to create more sophisticated, dynamic, and visually appealing reports. These techniques will help you transform standard reports into powerful business intelligence tools.
Implementing Dynamic Report Elements

Creating Calculated Fields
Calculated fields allow you to perform computations and transformations on your data:
- Use the expression builder to create formulas
- Leverage built-in functions for common calculations
- Reference multiple dataset fields in a single calculation
- Create running totals and aggregations
Building Expressions
Expressions are powerful formulas that can control nearly any aspect of your report:
// Example expression for conditional formatting
=IIF(Fields!Revenue.Value < 10000, "Red",
    IIF(Fields!Revenue.Value < 50000, "Yellow", "Green"))

// Example expression for dynamic visibility
=Parameters!ShowDetails.Value = True

// Example expression for calculated percentage
=Fields!CategorySales.Value / Sum(Fields!CategorySales.Value, "DataSet1") * 100
Using Parameters Effectively
Parameters make your reports interactive and reusable:
- Create parameters with appropriate data types and default values
- Use multi-value parameters for filtering multiple items
- Implement cascading parameters for hierarchical filtering
- Reference parameters in queries, expressions, and visibility settings
Parameter Flow in Reports
flowchart TD
    A[User Selects Parameter Values] --> B[Parameter Values Captured]
    B --> C{Parameter Type}
    C -->|Query Parameter| D[Modifies Dataset Query]
    C -->|Filter Parameter| E[Filters Data After Retrieval]
    C -->|Display Parameter| F[Controls Visual Elements]
    D --> G[Dataset Refreshed]
    E --> H[Data Filtered]
    F --> I[UI Elements Updated]
    G --> J[Report Rendered]
    H --> J
    I --> J
Visual Enhancements
Chart Type Comparison
Styling and Formatting Options
Enhance the visual appeal and readability of your reports:
- Apply consistent color schemes and typography
- Use conditional formatting to highlight important data
- Implement alternating row colors for better readability
- Create custom styles and templates for reuse across reports
Working with Charts and Data Visualizations
Visual representations can make data patterns immediately apparent:
- Choose appropriate chart types based on your data and message
- Configure chart properties for optimal data representation
- Implement drill-through from charts to detailed data
- Use gauges and indicators for KPI visualization
Interactive Features
Make your reports more engaging and useful with interactive elements:
Drill-Down Capabilities
Allow users to click on summary data to reveal underlying details, creating a hierarchical exploration experience.
Document Maps
Provide navigation aids that help users quickly jump to specific sections of large reports.
Clickable Actions
Enable navigation to other reports, external URLs, or trigger bookmarks when users click on report elements.

By mastering these advanced techniques, you can create reports that not only present data but also enable users to analyze and interact with it in meaningful ways. This transforms static reports into dynamic business intelligence tools.
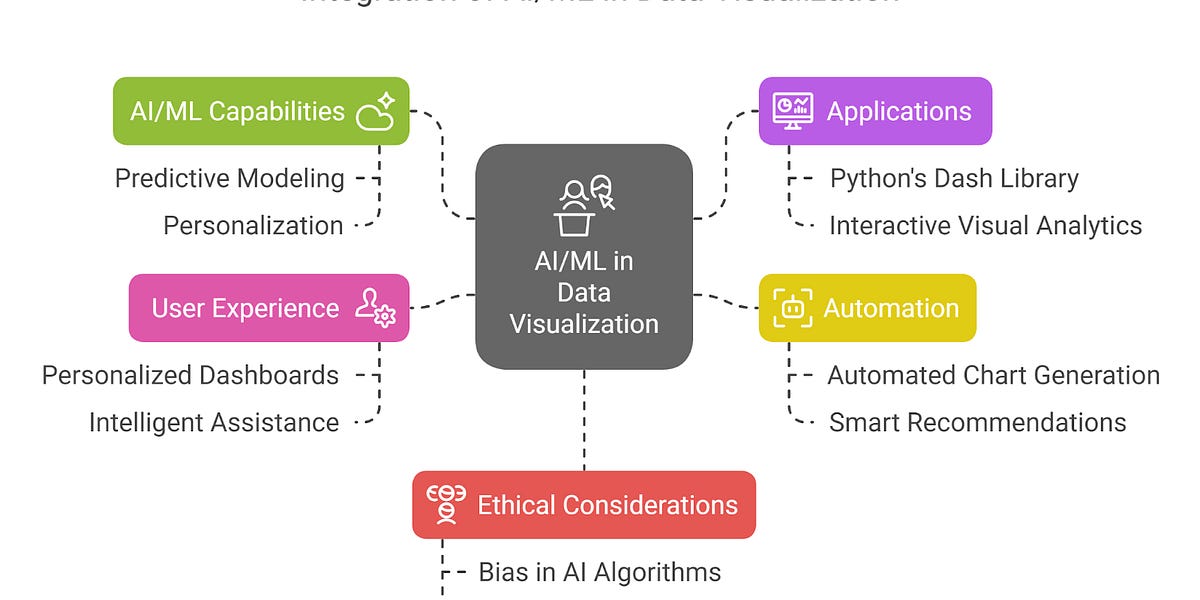
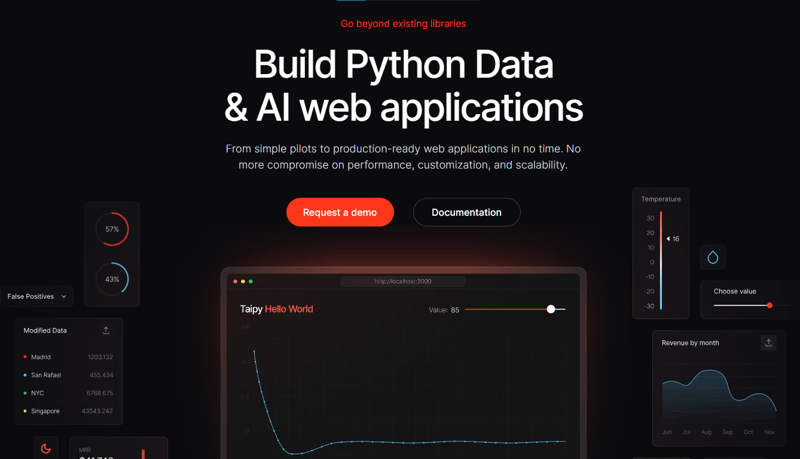
Transforming Complex Data into Clear Visualizations with PageOn.ai
While Visual Studio Report Designer is powerful, it comes with certain limitations when handling complex data relationships or when working with non-technical stakeholders. This is where PageOn.ai can complement your report design workflow.
Overcoming Visual Studio Report Designer Limitations
Complex Data Relationships
Visual Studio Report Designer can struggle with visualizing complex data relationships that require multiple linked visuals or interactive elements.
Steep Learning Curve
Non-technical users face significant barriers when trying to create or modify reports, leading to bottlenecks in the reporting process.
Time-Intensive Process
Building sophisticated reports from scratch requires significant development time, delaying insights and decision-making.
Prototype Limitations
Creating quick report prototypes for stakeholder feedback is challenging and resource-intensive.
How PageOn.ai Complements Report Design Workflow
PageOn.ai isn't a replacement for Visual Studio Report Designer but rather a powerful companion that enhances your reporting capabilities:
Integrated Report Design Workflow
flowchart TD
    A[Identify Reporting Need] --> B[Use PageOn.ai for Initial Concepts]
    B --> C[Generate Mockups via Natural Language]
    C --> D[Review with Stakeholders]
    D --> E{Approved?}
    E -->|No| C
    E -->|Yes| F[Implement in Visual Studio]
    F --> G[Develop Production Report]
    G --> H[Deploy Final Report]

    B -.-> I[Rapid Prototyping]
    B -.-> J[Visual Experimentation]
    B -.-> K[Stakeholder Alignment]
- Quickly generate initial report mockups through natural language commands
- Visualize complex data relationships before implementing in Visual Studio
- Create prototypes to validate report designs with stakeholders
- Reduce development cycles by clarifying requirements visually
Using PageOn.ai's AI Blocks to Structure Data Visualizations
AI report generators like PageOn.ai offer significant advantages when preparing to build complex reports:
- Combine visual elements fluidly without mastering complex designer interfaces
- Experiment with different chart types and layouts before committing to code
- Rapidly iterate on visualization approaches based on stakeholder feedback
- Generate visualization code snippets that can be adapted for your report
Time Savings: Traditional vs. PageOn.ai-Enhanced Workflow
By integrating AI business report generators like PageOn.ai into your workflow, you can significantly streamline the report design process, especially during the crucial initial phases where requirements and visualizations are still being defined.
Deployment and Distribution Strategies
Once you've created and perfected your report, you need effective strategies to deploy and distribute it to your users. Visual Studio Report Designer offers various options for making your reports accessible.
Exporting Reports to Various Formats
Popular Export Formats
Reports can be exported to various formats to meet different user needs:
| Format | Best For | Limitations |
|---|---|---|
| Distribution, printing, consistent layout | Limited interactivity, file size with many images | |
| Excel (XLSX) | Data analysis, further manipulation | Layout may change, complex visuals may not export well |
| Word (DOCX) | Editable reports, incorporating into documents | May lose some formatting, interactive elements |
| CSV | Raw data export, system integration | No formatting, no visuals, just data |
Deployment Options
Report Deployment Options
flowchart TD
    A[Report Deployment] --> B[Application Integration]
    A --> C[Report Server]
    A --> D[SharePoint]
    A --> E[Email Distribution]

    B --> B1[Windows Forms]
    B --> B2[Web Applications]
    B --> B3[Mobile Apps]

    C --> C1[SSRS]
    C --> C2[Custom Report Server]

    D --> D1[Document Library]
    D --> D2[Power BI Integration]

    E --> E1[Scheduled Reports]
    E --> E2[Alert-Based Reports]
Embedding Reports in Applications
Integrate reports directly into your applications for a seamless user experience:
- Use the appropriate viewer control for your application type
- Pass parameters programmatically based on application state
- Implement security to control report access
- Consider caching strategies for improved performance
// Example code for embedding a report in a .NET application
ReportViewer viewer = new ReportViewer();
viewer.ProcessingMode = ProcessingMode.Local;
viewer.LocalReport.ReportPath = "SalesReport.rdl";

// Add parameters
ReportParameter param = new ReportParameter("StartDate", startDate.ToString());
viewer.LocalReport.SetParameters(new ReportParameter[] { param });

// Refresh the report
viewer.RefreshReport();
Publishing to Report Servers
Deploy reports to a central server for organization-wide access:
- SQL Server Reporting Services (SSRS)
- DevExpress Report Server
- Telerik Report Server
- Custom report server solutions
Security Considerations
Protecting sensitive data is crucial when deploying reports:
Managing Report Access
Implement role-based security to control who can view, edit, or manage reports.
Handling Sensitive Data
Use data masking, encryption, and secure connections to protect confidential information.
Row-Level Security
Filter data based on user identity to ensure users only see data they're authorized to access.
By carefully planning your deployment strategy, you can ensure that your reports reach the right audience in the most effective format while maintaining appropriate security controls.
Troubleshooting and Optimization
Even well-designed reports can encounter issues during development or execution. Understanding common problems and knowing how to optimize your reports is essential for successful implementation.
Common Report Design Challenges
Performance Issues with Large Datasets
Reports that perform well with sample data may slow down significantly with production data volumes:
- Inefficient queries retrieving unnecessary data
- Too many grouping levels causing processing overhead
- Complex expressions evaluated for each row
- Large images or embedded content increasing rendering time
Layout Problems Across Different Export Formats
Reports may look different when exported to various formats:
- Page breaks occurring in unexpected locations
- Text wrapping differently than in the designer preview
- Charts and images resizing inappropriately
- Fonts and colors rendering inconsistently
Expression and Formula Errors
Logic errors in expressions can cause incorrect data or runtime errors:
- Division by zero errors
- Type conversion failures
- Incorrect aggregation scope
- Null reference exceptions
Common Error: One of the most frequent issues is using an aggregate function within another aggregate function without specifying the proper scope, resulting in "Aggregate functions cannot be nested" errors.
Debugging Techniques
Report Debugging Process
flowchart TD
    A[Identify Issue] --> B{Issue Type}
    B -->|Data| C[Check Dataset]
    B -->|Layout| D[Check Design]
    B -->|Performance| E[Check Execution]

    C --> C1[Preview Dataset]
    C --> C2[Verify Query]
    C --> C3[Check Parameters]

    D --> D1[Check Properties]
    D --> D2[Verify Expressions]
    D --> D3[Test with Sample Data]

    E --> E1[Profile Execution]
    E --> E2[Monitor Resources]
    E --> E3[Test Incremental Changes]

    C1 --> F[Fix Issue]
    C2 --> F
    C3 --> F
    D1 --> F
    D2 --> F
    D3 --> F
    E1 --> F
    E2 --> F
    E3 --> F
Using Visual Studio Debugging Tools
Leverage built-in debugging capabilities:
- Set breakpoints in custom code that interacts with reports
- Use the Output window to view error messages
- Examine the execution log for detailed processing information
Tracing Report Execution
Enable tracing to get detailed information about report processing:
- Configure trace logs in the report server settings
- Analyze execution times for different report components
- Identify bottlenecks in data retrieval or rendering
Optimization Strategies
Impact of Optimization Techniques
Query Optimization
Improve data retrieval performance:
- Select only the fields needed for the report
- Use appropriate filtering in the query rather than in the report
- Create indexed views or stored procedures for complex queries
- Consider pre-aggregating data for summary reports
Report Caching
Reduce execution time for frequently accessed reports:
- Enable report caching with appropriate expiration policies
- Use snapshot processing for large reports that don't need real-time data
- Implement session caching for interactive reports
Efficient Use of Subreports and Nested Data Regions
Structure complex reports for optimal performance:
- Minimize the number of subreports to reduce processing overhead
- Pass parameters efficiently between main reports and subreports
- Consider using tablix data regions instead of nested subreports
- Limit the depth of nested data regions to improve rendering speed
By applying these troubleshooting and optimization techniques, you can ensure your reports run efficiently and reliably, even with large datasets or complex visualizations. Regular performance testing and optimization should be part of your report development lifecycle.
Bridging the Gap Between Technical and Business Users
One of the biggest challenges in report development is effectively translating business requirements into technical implementations. This section explores how to bridge the gap between technical developers and business stakeholders.
Challenges in Traditional Report Design Processes

Technical Knowledge Barriers
Business users often struggle to articulate their needs in technical terms, while developers may not fully understand the business context.
Communication Gaps
Misunderstandings about requirements lead to reports that don't meet business needs, requiring costly revisions.
Lengthy Iteration Cycles
Traditional development processes involve multiple review cycles, delaying the delivery of critical business insights.
How PageOn.ai Transforms the Collaboration Process
Transformed Collaboration Workflow
flowchart TD
    A[Business Need Identified] --> B[Business User Expresses Need in Natural Language]
    B --> C[PageOn.ai Generates Visual Prototype]
    C --> D[Stakeholder Review]
    D --> E{Approved?}
    E -->|No| F[Refine Using Natural Language]
    F --> C
    E -->|Yes| G[Developer Implements in Visual Studio]
    G --> H[Technical Implementation]
    H --> I[Final Report Deployment]

    C -.-> J[Rapid Feedback Loop]
    F -.-> J
    J -.-> C
AI report summary generators and visualization tools like PageOn.ai are transforming how teams collaborate on reporting projects:
- Business users can express reporting needs in natural language
- Developers can leverage PageOn.ai's visual outputs as specifications
- Rapid prototyping reduces development cycles and improves alignment
- Visual concepts can be iterated quickly before committing development resources

Creating a Seamless Workflow Between PageOn.ai and Visual Studio Report Designer
Workflow Efficiency Comparison
To create an effective workflow between these tools:
- Initial Concept Phase: Use PageOn.ai for initial concept visualization and stakeholder alignment
- Design Specification: Export or document the agreed visual designs as specifications
- Technical Implementation: Implement finalized designs in Visual Studio Report Designer
- Visual Consistency: Maintain visual consistency across platforms for a cohesive user experience
- Iterative Refinement: Use PageOn.ai for quick iterations when requirements change
Best Practice: Create a visual style guide based on PageOn.ai prototypes that developers can reference when implementing reports in Visual Studio. This ensures consistency in colors, fonts, and visual elements across all reports.
By leveraging the strengths of both tools—PageOn.ai for rapid visualization and stakeholder communication, and Visual Studio Report Designer for robust implementation—you can create a more efficient and collaborative reporting process that delivers better results for both technical and business users.
Future-Proofing Your Reporting Strategy
As reporting technologies continue to evolve, it's essential to develop a forward-looking strategy that can adapt to changing requirements and leverage emerging capabilities.
Emerging Trends in Report Design

AI-Assisted Report Generation
AI tools are increasingly capable of generating reports from natural language prompts and understanding complex data relationships.
Interactive and Responsive Reporting
Reports are becoming more interactive, allowing users to explore data dynamically rather than viewing static information.
Cross-Platform Compatibility
Modern reports need to function seamlessly across desktop, web, and mobile platforms with consistent experiences.
Adoption Timeline of Reporting Technologies
Balancing Traditional Tools with Innovative Approaches
Hybrid Reporting Strategy
flowchart TD
    A[Reporting Need] --> B{Requirement Type}
    B -->|Complex Enterprise Reports| C[Visual Studio Report Designer]
    B -->|Rapid Visualization| D[PageOn.ai]
    B -->|Data Exploration| E[Modern BI Tools]

    C --> F[Formal Reports]
    C --> G[Compliance Documents]
    C --> H[Print-Optimized Output]

    D --> I[Concept Visualization]
    D --> J[Stakeholder Communication]
    D --> K[Rapid Prototyping]

    E --> L[Self-Service Analytics]
    E --> M[Interactive Dashboards]
    E --> N[Real-time Monitoring]

    F --> O[Hybrid Reporting Ecosystem]
    G --> O
    H --> O
    I --> O
    J --> O
    K --> O
    L --> O
    M --> O
    N --> O
To balance traditional tools with innovative approaches:
- When to use Visual Studio Report Designer:
- For complex, pixel-perfect reports requiring precise formatting
- When deep integration with .NET applications is needed
- For reports that must be printed with consistent layout
- When compliance with specific output formats is required
- When to use PageOn.ai and modern alternatives:
- For rapid prototyping and concept visualization
- When business users need to create reports without technical assistance
- For interactive, web-first reporting experiences
- When frequent changes to report designs are expected
Building a Sustainable Reporting Ecosystem
To ensure long-term success with your reporting strategy:
Training and Knowledge Transfer
Invest in training for both technical and business users to maximize the value of your reporting tools.
Documentation Best Practices
Maintain comprehensive documentation of report specifications, data sources, and design decisions.
Maintenance and Update Strategies
Establish regular review cycles to update reports and adapt to changing business requirements.
By embracing both traditional reporting tools like Visual Studio Report Designer and innovative solutions like AI tools for creating reports, you can build a flexible, future-proof reporting strategy that adapts to evolving business needs while maintaining the reliability and precision required for enterprise reporting.
The key is to recognize that these tools are complementary rather than competitive. Each has its strengths and ideal use cases, and the most successful organizations will leverage them together in a cohesive reporting ecosystem.
Transform Your Visual Expressions with PageOn.ai
Ready to take your report design process to the next level? PageOn.ai bridges the gap between complex data and clear visual communication, making it easier to create compelling reports that drive decision-making.
Conclusion
Visual Studio Report Designer remains a powerful tool for creating sophisticated, data-driven reports. Its deep integration with the Visual Studio environment and extensive capabilities make it ideal for enterprise reporting needs. However, the landscape of report design is evolving rapidly.
By complementing traditional tools like Visual Studio Report Designer with innovative solutions like PageOn.ai, organizations can create a more efficient, collaborative, and future-proof reporting ecosystem. This hybrid approach leverages the strengths of each tool:
- Visual Studio Report Designer provides robust implementation capabilities and precise control
- PageOn.ai offers rapid visualization, natural language interfaces, and improved stakeholder communication
- Together, they create a workflow that addresses both technical and business needs
As you continue your journey with Visual Studio Report Designer, remember that the goal is not just to create reports but to effectively communicate insights that drive business decisions. By embracing both traditional and innovative approaches to report format and design, you can create reporting solutions that truly meet the needs of your organization.
The future of report design lies not in choosing between traditional and AI-powered tools, but in skillfully combining them to create more effective, efficient, and impactful reporting experiences.
You Might Also Like
Transforming Value Propositions into Visual Clarity: A Modern Approach | PageOn.ai
Discover how to create crystal clear audience value propositions through visual expression. Learn techniques, frameworks, and tools to transform complex ideas into compelling visual narratives.
Multi-Format Conversion Tools: Transforming Modern Workflows for Digital Productivity
Discover how multi-format conversion tools are revolutionizing digital productivity across industries. Learn about essential features, integration strategies, and future trends in format conversion technology.
Transform Any Content into Professional Slides: The Ultimate Conversion Guide
Learn expert techniques for converting documents, presentations, and visual content into professional slides with this comprehensive guide to content format transformation.
From Boardroom to Brilliance: Master Real Story Techniques for Corporate Speakers
Discover powerful real story techniques for corporate speakers that increase memorability by 22x. Learn authentic storytelling methods, visualization strategies, and delivery techniques for business impact.