Making Data Speak: The Strategic Power of Line Charts in Decision-Making
Master the art of temporal visualization and transform raw data into actionable insights
Beyond Simple Lines: The Critical Decision Point
I've spent countless hours analyzing data across various industries, and I can tell you that the moment you choose your visualization method is critical. It's not just about making data look pretty—it's about making it speak clearly and compellingly to drive decisions.
Line charts stand as the cornerstone of temporal data analysis, and understanding when to deploy them transforms raw numbers into actionable insights. From my experience in financial forecasting to scientific research applications, I've seen how the right chart at the right time can illuminate patterns that would otherwise remain hidden.

In this comprehensive guide, I'll share the strategic framework I use to determine when line charts are your best ally and when they might lead you astray. We'll explore everything from the fundamental DNA of effective line charts to advanced implementation strategies that can revolutionize your data visualization charts approach.
The DNA of Effective Line Charts
Core Components That Make Line Charts Work
Through my years of creating visualizations, I've identified the essential elements that separate powerful line charts from confusing squiggles. Let me break down these core components:
-
•
The X-Axis Timeline Foundation: This horizontal axis typically represents time, creating a natural left-to-right progression that our brains instinctively understand.
-
•
Y-Axis Values: The vertical axis displays your measured values, and their continuous nature is what makes line charts so effective for showing gradual changes.
-
•
Data Points as Storytelling Markers: Each point represents a moment in time, and together they weave the narrative of your data's journey.
Interactive Example: Components in Action
When Line Charts Excel vs. When They Fail
I've learned through trial and error that line charts have their sweet spots and their danger zones. The key distinction lies in understanding continuous versus categorical data. When I'm working with continuous data that flows over time, line charts are my go-to tool. They excel at revealing trends, patterns, and relationships that might be invisible in raw numbers.
However, I've also seen line charts fail spectacularly when misapplied to categorical data. Connecting discrete categories with lines implies a continuity that doesn't exist, leading to misleading visualizations. This is where tools like PageOn.ai's AI Blocks become invaluable, helping you automatically select the right visualization type for your data structure.
Prime Scenarios for Line Chart Deployment
Time Series Mastery
In my work with financial data, I've found line charts indispensable for tracking stock market movements and identifying trading patterns. Whether I'm analyzing quarterly sales performance or monitoring website traffic patterns, the ability to see trends unfold over time provides insights that tables of numbers simply can't match.
Multi-Series Time Analysis
Trend Identification and Pattern Recognition
One of my favorite applications of line charts is spotting seasonal variations in business metrics. I recently helped a retail client identify that their sales consistently dipped in February but spiked in March—a pattern that was invisible in their monthly reports but crystal clear in a line chart spanning three years.

Line charts excel at revealing growth trajectories and decline patterns that inform strategic decisions. When I need to detect anomalies or outliers in continuous data, the visual representation makes these irregularities jump out immediately. By leveraging PageOn.ai's Vibe Creation feature, I can transform these complex patterns into clear, compelling visual narratives that resonate with stakeholders.
Multi-Variable Comparisons
When I need to compare multiple data series, line charts become even more powerful. I frequently overlay different metrics to reveal correlations and relationships. For instance, comparing marketing spend against customer acquisition over time can reveal the lag between investment and results—insights that drive more informed budget allocation.
The ability to visualize multiple variables simultaneously while maintaining clarity is what makes line charts superior to many alternatives when dealing with line graphs to visualize trends across different dimensions of your business.
Strategic Alternatives: When Line Charts Aren't the Answer
Categorical Data Challenges
I've seen too many presentations where line charts were forced onto categorical data, creating misleading visualizations. When I'm dealing with discrete categories—like comparing sales across different product types or regions—bar charts are my preferred choice. The distinction between bar charts vs histograms becomes crucial here, as each serves different purposes in representing distribution data.
Decision Framework: Line Chart vs. Alternatives
flowchart TD
                        A[Data to Visualize] --> B{Is it continuous?}
                        B -->|Yes| C{Over time?}
                        B -->|No| D[Use Bar Chart]
                        C -->|Yes| E[Use Line Chart]
                        C -->|No| F{Correlation?}
                        F -->|Yes| G[Use Scatter Plot]
                        F -->|No| H[Use Column Chart]
                        D --> I[Categorical Comparison]
                        E --> J[Trend Analysis]
                        G --> K[Relationship Discovery]
                        H --> L[Value Comparison]
Limited Data Points
When I'm working with just 4-5 data points, I've learned that column charts often provide better clarity than line charts. The sparse data doesn't create a meaningful trend line, and individual values become more important than the overall pattern. In these cases, horizontal bar charts can be particularly effective for categorical comparisons where you want to emphasize individual values rather than trends.
Complex Relationship Visualization
Sometimes the relationships in your data are too complex for a simple line chart. When I need to analyze correlations between variables that don't have a time component, scatter plots become my tool of choice. For multi-dimensional data, heat maps can reveal patterns that would be lost in a line chart. And when dealing with interconnected relationships, network diagrams provide insights that no line chart could match.

Industry-Specific Applications and Case Studies
Finance and Investment
In my finance consulting work, I've implemented line charts for everything from daily stock price movements to long-term portfolio performance tracking. The ability to visualize volatility patterns and identify support and resistance levels has proven invaluable for investment decisions. Interest rate trends and economic indicators come alive when plotted over time, revealing cycles and correlations that inform strategic positioning.
Using PageOn.ai's Agentic process, I can now create dynamic financial reports that update in real-time, ensuring that investment decisions are based on the most current data available.
Financial Performance Tracking
Healthcare and Scientific Research
My experience in healthcare analytics has shown me how critical line charts are for patient monitoring. Tracking vital signs over treatment periods reveals response patterns that guide medical decisions. In clinical trials, line charts effectively display efficacy trends, making it easier to identify when treatments begin showing results.
Climate researchers I've worked with rely heavily on line charts to visualize temperature variations and identify long-term trends. Population growth patterns and demographic shifts become immediately apparent when plotted over decades, informing policy decisions and resource allocation.
Business Intelligence and Marketing
In the business intelligence realm, I've found line charts essential for tracking customer acquisition costs over time. They reveal seasonal patterns and the impact of marketing campaigns with clarity that spreadsheets can't match. Conversion rate optimization becomes more strategic when you can visualize trends and identify what's working.
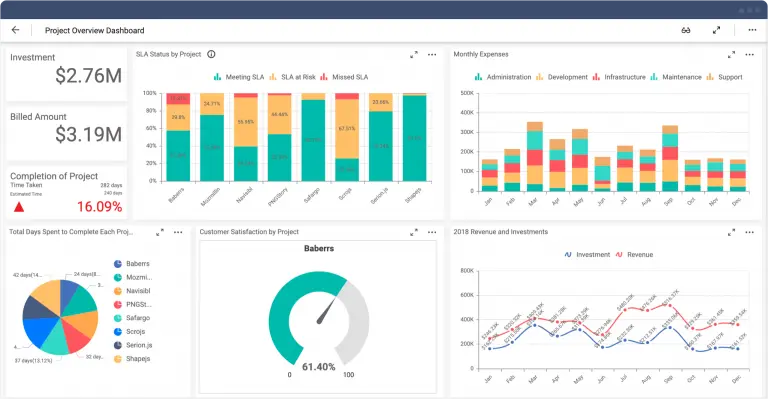
Social media engagement evolution and revenue growth trajectories tell powerful stories through line charts. By building comprehensive dashboards using comparison chart creation tools, I help businesses see the full picture of their performance across multiple metrics simultaneously.
Best Practices for Maximum Impact
Design Principles
Through years of creating visualizations, I've developed a set of design principles that ensure line charts communicate effectively. Choosing appropriate time intervals for the x-axis is crucial—too granular and you lose the forest for the trees, too broad and you miss important fluctuations.
My Essential Design Checklist:
- ✓ Select time intervals that match your analysis needs
- ✓ Use consistent scaling for accurate representation
- ✓ Apply distinct colors for multi-line clarity (maximum 5-7 lines)
- ✓ Add annotations to highlight key insights and turning points
- ✓ Include gridlines for easier value reading
- ✓ Label axes clearly with units of measurement
Common Pitfalls to Avoid
I've learned from mistakes—both mine and others'—what can destroy the effectiveness of a line chart. Overcrowding with too many lines is a common error; I strictly limit myself to 5-7 lines maximum. Any more and the chart becomes an unreadable tangle that confuses rather than clarifies.
Misleading dual-axis implementations have caused me headaches in the past. While they can be useful, they're often manipulated to create false correlations. I now use them sparingly and always with clear labeling. Understanding when zero-baseline requirements apply and when they can be relaxed has also been crucial for creating honest, effective visualizations.
Interactive Enhancement Strategies
Modern line charts aren't static images—they're interactive experiences. I always add hover tooltips that reveal detailed information about each data point. Implementing zoom and pan functionality allows viewers to explore different time scales and focus on areas of interest.
Creating drill-down capabilities for deeper analysis transforms a simple line chart into a powerful analytical tool. This is where PageOn.ai truly shines, allowing me to transform static charts into interactive narratives that engage viewers and facilitate exploration.
Advanced Techniques and Variations
Specialized Line Chart Types
Beyond basic line charts, I've found specialized variations that serve specific purposes brilliantly. Area charts add a filled region below the line, perfect for showing cumulative impact or volume over time. Sparklines—those tiny, word-sized line charts—provide compact trend indicators that I embed directly in reports and dashboards.
Area Chart: Cumulative Growth Visualization
Step lines work wonderfully for discrete change representation, particularly when showing rate changes or tier-based pricing over time. The choice between smoothed curves and straight segments depends on your data's nature—smooth curves suggest gradual change, while straight segments emphasize discrete measurement points.
Hybrid Approaches
I've discovered that combining visualization types can create powerful insights. Mixing line and bar elements on the same chart allows me to show trends alongside discrete events or milestones. Dual-axis charts, when used appropriately, can reveal relationships between metrics with different scales.

Stacked area variations help visualize how different components contribute to a total over time. These hybrid approaches expand the storytelling potential of your data, though they require careful design to maintain clarity.
Implementation Tools and Technologies
Software Selection Criteria
Choosing the right tool for creating line charts depends on your technical expertise and visualization needs. I started with Excel and Google Sheets—they're accessible and perfect for basic line charts. As my needs grew more complex, I moved to specialized platforms like Tableau and Power BI, which offer advanced customization and interactivity.
For web-based visualizations, programming libraries like D3.js, Plotly, and Highcharts provide unlimited flexibility. However, the learning curve can be steep. This is where PageOn.ai has revolutionized my workflow—it combines the power of advanced visualization with the simplicity of a user-friendly interface, streamlining the entire process from data input to final presentation.
| Tool | Best For | Learning Curve | Interactivity |
|---|---|---|---|
| Excel/Google Sheets | Quick, simple charts | Low | Limited |
| Tableau/Power BI | Business dashboards | Medium | High |
| D3.js/Plotly | Custom web visualizations | High | Unlimited |
| PageOn.ai | AI-powered storytelling | Low | High |
Data Preparation Essentials
Before creating any line chart, I ensure my data is properly organized. Time-series data must be in chronological order with consistent intervals clearly defined. I've developed strategies for handling missing values—whether to interpolate, use markers to indicate gaps, or exclude incomplete periods entirely depends on the context and audience.
Outlier detection and treatment is crucial for maintaining chart integrity. I always perform quality checks before visualization, ensuring that anomalies are either genuine insights or data errors to be corrected. Aggregation strategies vary by time scale—daily data might need weekly or monthly rollups for long-term trend analysis.
Future-Proofing Your Data Visualization Strategy
The landscape of data visualization is evolving rapidly, and I'm excited about the emerging trends in line chart applications. Real-time data integration is becoming standard, allowing dashboards to update continuously as new data flows in. AI-powered trend prediction overlays are adding a new dimension to traditional line charts, helping us see not just where we've been, but where we're likely heading.
The Evolution of Line Chart Capabilities
flowchart LR
                        A[Traditional Static Charts] --> B[Interactive Dashboards]
                        B --> C[Real-time Updates]
                        C --> D[AI-Enhanced Predictions]
                        D --> E[Immersive AR/VR Visualizations]

                        style A fill:#f9f9f9
                        style B fill:#e6f3ff
                        style C fill:#ffe6cc
                        style D fill:#FF8000,color:#fff
                        style E fill:#ffcccc
Mobile-first design considerations are now essential. I ensure all my line charts are responsive and touch-friendly, recognizing that many decision-makers review data on tablets and smartphones. Building scalable visualization systems means thinking beyond individual charts to create cohesive visual narratives.
PageOn.ai's AI Blocks represent the future I'm embracing—intelligent systems that understand your data's context and automatically suggest the most effective visualizations. This technology doesn't replace human judgment; it enhances it, allowing us to focus on interpretation and decision-making rather than technical implementation.
Mastering the Art of Temporal Visualization
After years of working with data visualization, I've learned that choosing when to use a line chart isn't just a technical decision—it's a strategic one. The key criteria I always consider are: Is my data continuous? Does it change over time? Am I trying to show trends rather than discrete comparisons?
The balance between simplicity and information density is delicate but crucial. A well-designed line chart can convey complex trends at a glance, empowering data-driven decisions that might otherwise be buried in spreadsheets. By following the principles and practices I've shared, you can transform your data storytelling capabilities.
Your Next Steps:
- 1. Audit your current visualizations—are you using line charts appropriately?
- 2. Implement the decision framework to choose the right chart type
- 3. Apply best practices to enhance clarity and impact
- 4. Explore advanced techniques for complex data stories
- 5. Leverage modern tools to streamline your workflow
Transform Your Visual Expressions with PageOn.ai
Ready to revolutionize how you create and present line charts? PageOn.ai's comprehensive visualization suite combines AI-powered insights with intuitive design tools, helping you craft compelling data stories that drive decisions. From automatic chart selection to interactive storytelling features, discover how PageOn.ai can elevate your data visualization game.
Start Creating with PageOn.ai TodayYou Might Also Like
The Art of Yes Ladders: Building Momentum to Overcome Sales Objections
Discover how to build effective yes ladders in sales conversations to overcome objections and create momentum toward closing deals with proven psychological techniques and strategies.
Building Powerful Real-World AI Applications with PostgreSQL and Claude | PageOn.ai
Learn how to build sophisticated AI applications by integrating PostgreSQL and Claude AI. Discover architecture patterns, implementation techniques, and optimization strategies for production use.
The Strategic GIF Guide: Creating Memorable Moments in Professional Presentations
Discover how to effectively use GIFs in professional presentations to create visual impact, enhance audience engagement, and communicate complex concepts more memorably.
Revolutionizing Slide Deck Creation: How AI Tools Transform Presentation Workflows
Discover how AI-driven tools are transforming slide deck creation, saving time, enhancing visual communication, and streamlining collaborative workflows for more impactful presentations.