Mastering X-bar and R Charts: Transform Statistical Process Control Into Visual Intelligence
I've spent years working with quality control teams who struggle to make sense of statistical process control. Today, I'm sharing how X-bar and R charts can become your most powerful tools for understanding process stability—when you know how to visualize them effectively.
Introduction: From Numbers to Narrative
I remember my first encounter with X-bar and R charts during a quality improvement project at a manufacturing facility. The production manager handed me stacks of data, expecting insights that could transform their process. What struck me wasn't the complexity of the statistics—it was how difficult it was to communicate these insights to the team who needed them most.
X-bar and R charts represent one of the most powerful paired tools in statistical process control. They work together like a skilled detective team—the X-bar chart monitors the average performance of your process, while the R chart keeps watch over consistency and variation. Together, they tell a complete story about process stability that neither could reveal alone.
The challenge I've observed across industries isn't understanding the mathematics—it's making these charts accessible and actionable for everyone from operators to executives. Traditional methods of creating and maintaining these charts often become bottlenecks in quality improvement efforts. That's where modern visualization tools like PageOn.ai's AI Blocks transform the game, turning complex statistical monitoring into clear visual narratives that drive action.
The Dual Architecture of Process Control
The X-bar Chart Component
When I explain the X-bar chart to teams, I often use the analogy of monitoring your daily commute time. The X-bar chart tracks the average—if you measure your commute multiple times each day, the X-bar would show your daily average commute time over weeks or months. This helps you detect when something fundamentally changes in your route or traffic patterns.
In manufacturing or service processes, the X-bar chart monitors the mean of your measurements across subgroups. It's particularly powerful for detecting shifts in process centering—those gradual or sudden changes that indicate something has fundamentally altered in your process. With PageOn.ai's drag-and-drop chart builders, I've seen teams create these visualizations in minutes rather than hours, allowing them to focus on interpretation rather than construction.
The R Chart Component
The R chart, or Range chart, tells a different but equally important story. It monitors the spread or variation within each subgroup. Continuing our commute analogy, while the X-bar chart shows if your average commute time changes, the R chart shows if your commute is becoming more or less predictable—are some days taking much longer than others?
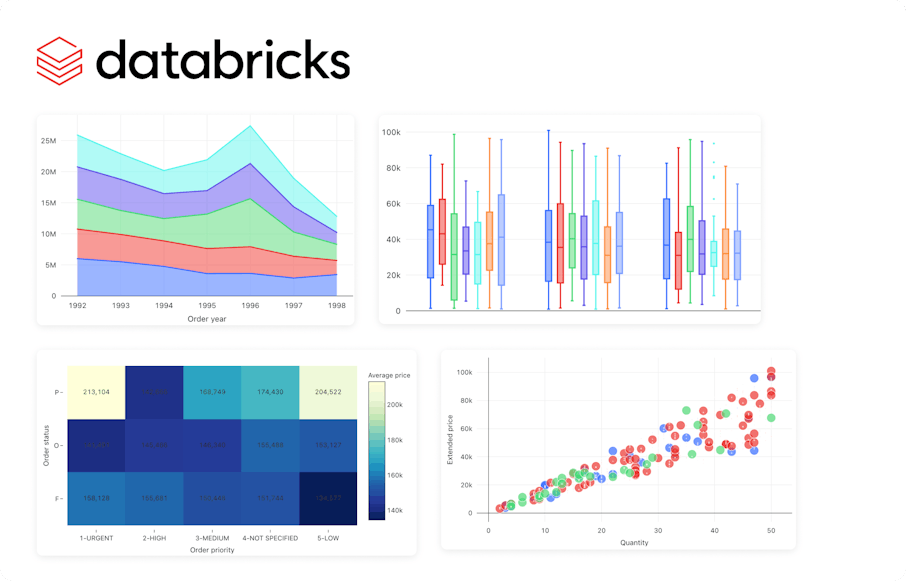
Interactive X-bar and R Chart Example
The following charts show how X-bar and R work together to monitor process stability:
The Symbiotic Relationship
Here's a critical insight I always emphasize: you must interpret the R chart before the X-bar chart. Why? Because the control limits on the X-bar chart are calculated using the average range (R-bar). If your R chart shows out-of-control points, your X-bar control limits aren't trustworthy.
This interdependence makes these charts particularly powerful when used together. Using PageOn.ai's Vibe Creation feature, I've helped teams build linked chart systems where updates to one automatically reflect in the other, maintaining this critical relationship while eliminating manual calculation errors.
Mathematical Foundations Made Visual
Core Calculations and Constants
While the mathematics behind X-bar and R charts might seem daunting, I've found that visualizing these calculations transforms understanding. Let me break down the essential formulas that power these charts.

For the X-bar calculation, we simply average the measurements within each subgroup. If you have 5 measurements in a subgroup, add them up and divide by 5. The range calculation is even simpler—subtract the smallest value from the largest within each subgroup.
The magic happens with the control chart constants: A2, D3, and D4. These values, which depend on your subgroup size, have been statistically derived to give you the right control limits. With PageOn.ai's AI Blocks, I've created interactive calculators where teams can input their subgroup size and instantly see the appropriate constants applied to their data.
Control Limit Calculation Process
Understanding the flow of calculations helps ensure accurate chart construction:
                    flowchart TD
                        A[Collect Data in Subgroups] --> B[Calculate X-bar for each subgroup]
                        A --> C[Calculate R for each subgroup]
                        B --> D[Calculate X-double-bar]
                        C --> E[Calculate R-bar]
                        E --> F[Determine R Chart Control Limits]
                        F --> G{R Chart in Control?}
                        G -->|Yes| H[Calculate X-bar Chart Control Limits]
                        G -->|No| I[Investigate Special Causes]
                        H --> J[Complete Control Chart]
                        I --> A
Control Limit Construction
The control limits define the boundaries of normal process variation. For the X-bar chart, we calculate:
- Upper Control Limit (UCL) = X̄̄ + (A2 × R̄)
- Lower Control Limit (LCL) = X̄̄ - (A2 × R̄)
For the R chart:
- Upper Control Limit (UCL) = D4 × R̄
- Lower Control Limit (LCL) = D3 × R̄
What I love about PageOn.ai's Deep Search capability is how it automatically retrieves the correct constants based on your subgroup size, eliminating the need to reference tables manually. This automation reduces errors and speeds up the chart creation process significantly.
Real-World Applications Across Industries
Manufacturing Excellence
In my work with automotive manufacturers, I've seen X-bar and R charts prevent millions in warranty claims. One memorable project involved monitoring ignition coil lengths across three machines running three shifts daily. The quality engineer measured five coils from each machine during each shift, creating natural subgroups for analysis.
The pharmaceutical industry presents unique challenges where precision is literally life-saving. I've helped teams monitor tablet weights, where even minor variations can affect drug efficacy. The R chart becomes particularly critical here, as increased variation often signals equipment wear before it affects the average weight.
In electronics manufacturing, controlling circuit board thickness requires monitoring at the micron level. Using PageOn.ai's template system, we created industry-specific control charts that automatically adjust scale and precision based on the measurement type, making it easier for operators to spot meaningful variations.
Service and Healthcare
Service industries benefit enormously from X-bar and R charts, though the application looks different. I worked with a call center that used these charts to monitor handle times. They discovered that while average handle time remained stable (X-bar chart), the variation was increasing (R chart), indicating inconsistent training among new agents.
In healthcare, these charts literally save lives. I've implemented systems monitoring patient vital signs where the R chart detecting increased variation prompted early intervention before the average values shifted into dangerous territory. The ability to create customized dashboards combining multiple chart types using PageOn.ai's modular approach has been transformative for nursing stations.
Implementation Strategy and Best Practices
Data Collection and Subgrouping
The foundation of effective X-bar and R charts lies in rational subgrouping. I always tell teams: your subgroups should capture the variation you want to detect between groups, while minimizing variation within groups. This isn't just statistical theory—it's practical wisdom that makes your charts actionable.
Optimal subgroup sizes typically range from 4 to 5 samples. Why? Smaller subgroups might miss important variations, while larger ones can mask changes. I've found that PageOn.ai's Agentic processes can analyze your historical data and suggest optimal grouping strategies based on your specific process characteristics.
| Subgroup Size | A2 Constant | D3 Constant | D4 Constant | Best Used When |
|---|---|---|---|---|
| 2 | 1.880 | 0 | 3.267 | Limited samples available |
| 3 | 1.023 | 0 | 2.574 | Quick response needed |
| 4 | 0.729 | 0 | 2.282 | Good balance of sensitivity |
| 5 | 0.577 | 0 | 2.114 | Most common choice |
Chart Construction Steps
I recommend starting with at least 20-25 subgroups before calculating control limits. This gives you a stable baseline for comparison. Here's my proven process:
- Collect initial data systematically
- Calculate averages and ranges for each subgroup
- Plot preliminary points to check for obvious issues
- Calculate control limits only after confirming data quality
- Validate the R chart before interpreting the X-bar chart
What used to take hours of manual plotting can now be accomplished with voice commands through PageOn.ai. I've watched operators simply describe their data structure and watch as professional-quality charts appear, complete with proper scaling and control limits.
Advanced Interpretation and Analysis
Reading the Patterns
Control charts speak a visual language that goes beyond simple "in control" or "out of control" signals. I've trained hundreds of operators to recognize patterns that predict problems before they occur. The Western Electric rules provide a framework for identifying non-random patterns even when all points fall within control limits.
For instance, seven consecutive points on one side of the centerline suggest a process shift, even if none breach the control limits. Eight points in a row steadily increasing or decreasing indicate a trend that demands investigation. Using PageOn.ai's intelligent alert systems, we can create visual indicators that automatically highlight these patterns, making them impossible to miss.
Process Capability Integration
Here's a crucial principle I emphasize: control must precede capability. You cannot meaningfully calculate Cp or Cpk values until your process demonstrates statistical control. I've seen too many teams rush to capability studies only to find their calculations meaningless because the process was unstable.
Once control is established, the relationship between control limits and specification limits tells a powerful story. Control limits reflect what your process is doing; specification limits show what it needs to do. When I build comprehensive quality dashboards linking control and capability metrics using PageOn.ai, stakeholders finally see the complete picture of process performance.
Digital Transformation of SPC
From Paper to Pixels
I've witnessed the evolution from hand-drawn control charts on graph paper to today's intelligent visualization systems. The transformation isn't just about convenience—it's about capability. Manual charting limited us to reactive quality control; digital systems enable predictive quality management.
The benefits of automated data visualization charts extend far beyond time savings. Real-time monitoring means catching problems as they occur, not hours or days later. Alert systems ensure critical signals never go unnoticed. Most importantly, digital systems democratize quality data—making it accessible to everyone who needs it.
Digital SPC Evolution
The journey from manual to intelligent quality systems:
                    flowchart LR
                        A[Manual Charts] --> B[Excel-Based]
                        B --> C[Dedicated SPC Software]
                        C --> D[Cloud-Based Systems]
                        D --> E[AI-Enhanced Visualization]
                        E --> F[Predictive Quality Analytics]

                        style A fill:#f9f9f9
                        style F fill:#FF8000,color:#fff
Modern QMS Integration
Today's quality management systems demand more than standalone control charts. They require integrated ecosystems where SPC data flows seamlessly into broader quality metrics. I've helped organizations embed X-bar and R charts into their electronic QMS, creating single sources of truth for quality data.
Automated data collection from production equipment eliminates transcription errors and ensures real-time updates. But the real magic happens when we create role-specific dashboards. Operators see real-time charts with clear action triggers. Engineers access detailed statistical analyses. Executives view trend summaries and predictive insights. PageOn.ai's ability to transform complex QMS outputs into executive-ready visual reports has been game-changing for my clients.
Common Pitfalls and Solutions
Typical Implementation Errors
After years of consulting, I've catalogued the most common mistakes teams make with X-bar and R charts. The biggest? Using these charts with subgroups larger than 10. Once you exceed this size, the range becomes an inefficient measure of variation—you need to switch to X-bar and S charts using standard deviation.
Another critical error I see repeatedly: plotting specification limits on control charts. This confuses operators and leads to incorrect actions. Control limits tell you about process stability; specification limits tell you about product acceptability. They serve different purposes and mixing them muddles both messages.
Perhaps the most dangerous mistake is ignoring the R chart while focusing solely on the X-bar chart. I've seen teams celebrate stable averages while missing increasing variation that eventually led to quality crises. PageOn.ai's intelligent chart selection guidance helps prevent these errors by recommending the appropriate chart type based on your data characteristics.
Optimization Strategies
When subgroup sizes vary—a common challenge in real-world applications—you have options. I typically recommend using control limits based on average subgroup size for minor variations, or creating adaptive limits that adjust for each subgroup. Modern visualization tools can handle these complexities automatically.
For non-normal distributions, transformation techniques or alternative chart types may be necessary. I've successfully used Box-Cox transformations to normalize data before charting, or switched to individual-moving range charts for naturally non-normal processes. The key is recognizing when standard approaches don't apply and having alternatives ready.
Future-Proofing Your SPC Practice
Industry 4.0 Integration
The future of SPC lies in intelligent integration with Industry 4.0 technologies. I'm working with manufacturers who connect control charts directly to IoT sensors, creating real-time quality loops that respond faster than human operators ever could. Machine learning algorithms now detect subtle patterns in control charts that experienced quality engineers might miss.
Industry 4.0 SPC Capabilities
Modern SPC systems integrate multiple advanced technologies:
Building next-generation SPC systems that combine traditional methods with AI insights requires thoughtful integration. PageOn.ai bridges this gap beautifully, allowing teams to maintain the rigor of traditional SPC while leveraging modern visualization and analysis capabilities.
Continuous Improvement Culture
The most sophisticated control charts mean nothing without a culture that values and acts on their insights. I've learned that successful SPC implementation requires more than technical training—it demands cultural transformation. Operators need to feel empowered to stop production when charts signal problems. Engineers must view control charts as conversation starters, not report cards.
Creating visual management systems for the shop floor transforms abstract statistics into actionable intelligence. I've used PageOn.ai to convert training materials into interactive visual guides that operators actually want to use. When quality data becomes visually engaging and immediately understandable, it naturally becomes part of daily decision-making.
Conclusion: Elevating Quality Through Visual Intelligence
X-bar and R charts have endured for nearly a century because they answer fundamental questions about process behavior that remain relevant regardless of technology advances. Yet their true power emerges when we move beyond static charts to dynamic, intelligent monitoring systems that speak to every level of an organization.
Throughout my career, I've seen how the right visualization transforms statistical complexity into actionable insights. Modern tools like PageOn.ai don't replace the need for statistical understanding—they amplify its impact by making insights accessible to everyone who needs them. When quality professionals can focus on improvement rather than chart construction, entire organizations benefit.
The future of quality control isn't about choosing between traditional methods and modern technology. It's about thoughtful integration that preserves statistical rigor while embracing visual intelligence. As we continue advancing toward predictive and prescriptive quality systems, X-bar and R charts remain foundational tools—now enhanced with capabilities that would have seemed like magic to their creators.
I encourage you to reimagine your approach to SPC. Move beyond viewing control charts as compliance requirements and see them as powerful communication tools. Create visual languages for quality that resonate from the shop floor to the boardroom. Most importantly, remember that behind every data point is an opportunity to improve not just processes, but the products and services that impact real people's lives.
Transform Your Visual Expressions with PageOn.ai
Ready to revolutionize how you create and share statistical process control insights? PageOn.ai empowers you to transform complex quality data into stunning, interactive visualizations that drive action and understanding across your organization.
Start Creating with PageOn.ai TodayYou Might Also Like
Creating Dynamic LLM Comparison Presentations with Model Context Protocol | Visual Guide
Learn how to build effective LLM comparison presentations using Model Context Protocol. Explore visualization techniques, decision frameworks, and implementation roadmaps with PageOn.ai.
Vibe Coding: Transforming Ideas into Working Software Through Natural Language
Discover how vibe coding revolutionizes software development by using natural language to create working code. Learn the mechanics, workflow, and future of this AI-powered approach.
The Critical Human Element: Mastering AI Tool Selection for Impactful Presentations
Discover how to leverage human judgment when selecting AI presentation tools. Learn to balance automation with creativity for truly impactful, connection-driven presentations.
Streamlining Presentation Preparation: Efficient Copy-Pasting Techniques & Smart Integration
Discover advanced copy-paste techniques and AI-powered alternatives to transform your presentation workflow. Learn how to save time and maintain consistency across slides.