Master Flowchart Creation: From Canva Basics to AI-Powered Visual Excellence
I've spent countless hours creating flowcharts, and I'm here to share everything from Canva's traditional approach to revolutionary AI-powered solutions that will transform how you visualize processes.
Understanding the Flowchart Foundation
When I first started creating flowcharts, I quickly realized they're not just pretty diagrams – they're essential tools for visualizing complex processes that would otherwise be lost in walls of text. Whether you're mapping a customer journey or documenting a technical workflow, flowcharts transform abstract concepts into clear, visual narratives.

Understanding flowchart symbols is crucial for effective process mapping. Each shape carries specific meaning – rectangles for processes, diamonds for decisions, and parallelograms for inputs and outputs. I've found that consistent symbol usage is what separates professional diagrams from amateur attempts.
The Traditional Challenge
In my experience with traditional flowchart creation in tools like Canva, I've encountered several persistent challenges:
- Time-consuming manual shape placement and alignment that can take hours for complex diagrams
- Limited dynamic features when creating complex decision trees with multiple branches
- Difficulty maintaining visual consistency across multiple related diagrams
When to Choose Flowcharts Over Other Visualizations
I've developed this decision tree to help you determine when flowcharts are your best visualization option:
                    flowchart TD
                        A[Need to Visualize Information] --> B{Is it a process or sequence?}
                        B -->|Yes| C{Multiple decision points?}
                        B -->|No| D[Consider other formats]
                        C -->|Yes| E[Use Flowchart]
                        C -->|No| F{Linear progression?}
                        F -->|Yes| G[Use Timeline/Steps]
                        F -->|No| E
                        D --> H[Data comparison?]
                        H -->|Yes| I[Use Charts/Graphs]
                        H -->|No| J[Relationships?]
                        J -->|Yes| K[Use Mind Map]
                        J -->|No| L[Use Infographic]

                        style E fill:#FF8000,stroke:#333,stroke-width:2px,color:#fff
                        style A fill:#f9f9f9,stroke:#333,stroke-width:2px
Canva's Flowchart Creation Process
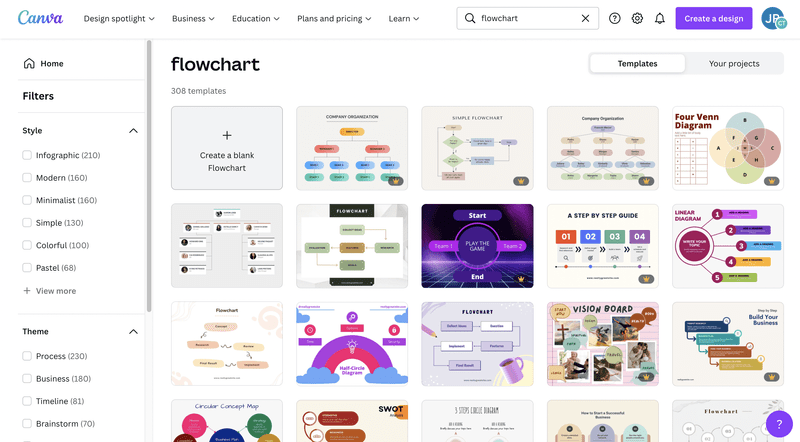
I've spent considerable time mastering Canva's flowchart maker, and I can guide you through the exact process that yields professional results. According to Canva's official flowchart resources, the platform offers both templates and whiteboard tools for creating process flows.
Step-by-Step Walkthrough
- Access templates through "Process Flow" search in Canva
- Choose between Canva Whiteboards for infinite canvas space
- Select pre-designed templates or start from scratch
- Customize shapes, colors, and connections
- Add text and refine alignment with grids
Essential Features I Use Daily
- Shape Assist for perfecting geometric elements
- Quick flow diagram creation from shapes library
- Color coding for different process branches
- Grid systems for professional alignment
- Magic Write for text summarization
Time Investment for Different Flowchart Complexities
Based on my experience, here's how long different flowchart types typically take in Canva:
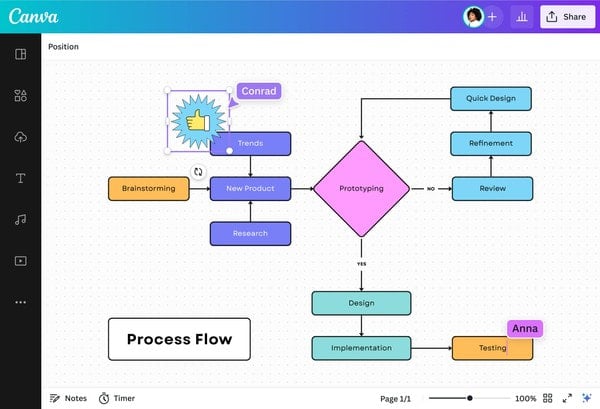
Collaboration Capabilities
What I particularly appreciate about Canva's approach is the collaboration features:
- Real-time team editing allows multiple stakeholders to contribute simultaneously
- Sticky notes facilitate brainstorming sessions before finalizing the flow
- Timer features help maintain focus during workshop sessions
- Comments and reactions enable asynchronous feedback
Advanced Techniques and Limitations
After creating hundreds of flowcharts, I've discovered both powerful techniques and frustrating limitations in Canva. Let me share what I've learned about pushing the boundaries of what's possible.
Creating Complex Multi-Path Flowcharts
I've developed strategies for building sophisticated workflows that go beyond basic templates. Using parallelograms for resource inputs/outputs, implementing multiple arrows for decision branches, and creating interactive decision trees requires careful planning and execution.
Example: Multi-Path Customer Support Flowchart
Here's a complex flowchart structure I often create for customer support workflows:
                    flowchart TD
                        Start[Customer Contact] --> Type{Contact Method?}
                        Type -->|Email| Email[Email Queue]
                        Type -->|Phone| Phone[Phone Queue]
                        Type -->|Chat| Chat[Live Chat]

                        Email --> Priority1{Priority Level?}
                        Phone --> Priority2{Priority Level?}
                        Chat --> Priority3{Priority Level?}

                        Priority1 -->|High| Urgent1[Immediate Response]
                        Priority1 -->|Medium| Normal1[4-Hour Response]
                        Priority1 -->|Low| Standard1[24-Hour Response]

                        Priority2 -->|High| Urgent2[Next Available Agent]
                        Priority2 -->|Medium| Normal2[5-Min Wait]
                        Priority2 -->|Low| Standard2[Callback Option]

                        Priority3 -->|High| Urgent3[Priority Queue]
                        Priority3 -->|Medium| Normal3[Standard Queue]
                        Priority3 -->|Low| Standard3[Bot First]

                        Urgent1 --> Resolution[Issue Resolution]
                        Normal1 --> Resolution
                        Standard1 --> Resolution
                        Urgent2 --> Resolution
                        Normal2 --> Resolution
                        Standard2 --> Resolution
                        Urgent3 --> Resolution
                        Normal3 --> Resolution
                        Standard3 --> Resolution

                        Resolution --> Feedback[Customer Feedback]
                        Feedback --> End[Case Closed]

                        style Start fill:#FF8000,stroke:#333,stroke-width:2px,color:#fff
                        style End fill:#66BB6A,stroke:#333,stroke-width:2px,color:#fff
Canva's Constraints for Sophisticated Workflows
I've encountered several limitations that can be frustrating when working on complex projects:
- Static nature of exported flowcharts – no interactivity in final outputs
- Limited automation for data-driven diagrams that need regular updates
- Challenges with creating truly interactive slides on Canva
- No native support for conditional logic or dynamic content
My Workarounds and Optimization Tips
Over time, I've developed several workarounds to maximize Canva's capabilities:
- Embedding flowcharts in Canva Docs for better context and documentation
- Using Magic Write to quickly summarize complex process descriptions
- Leveraging the Draw feature for custom elements when templates fall short
- Creating modular components that can be reused across multiple diagrams
- Exporting at high resolution and using external tools for interactivity
Elevating Flowcharts with AI-Powered Solutions
The evolution from manual to AI-powered flowchart tools has completely transformed my workflow. What used to take hours now takes minutes, and the results are more dynamic and adaptable than ever before.
How PageOn.ai Transforms Flowchart Creation
I've been amazed by how PageOn.ai revolutionizes the entire process. Instead of manually dragging and dropping shapes, I can now:
Voice-to-Visual
Describe your process verbally and watch it materialize into a professional flowchart instantly
AI Blocks
Build complex diagrams like LEGOs with modular, intelligent components
Deep Search
Automatically incorporate relevant data and assets into your visualizations
Traditional vs. AI-Enhanced Workflow Comparison
Here's my assessment of key factors comparing traditional Canva workflows with AI-powered solutions:
Real Impact on My Workflow
The transformation has been remarkable:
- Time savings: What took hours now takes seconds for complex diagrams
- Dynamic adaptability: Flowcharts update automatically with new data
- Intelligent suggestions: AI recommends optimal layouts based on process context
- Version control: Easy tracking and rollback of diagram changes
Real-World Applications and Best Practices
Through my work with various organizations, I've applied flowchart techniques across diverse scenarios. Let me share some flowchart examples and best practices that have proven most effective.
Business Process Documentation
- Employee onboarding workflows
- Customer journey mapping
- Order fulfillment processes
- Quality assurance procedures
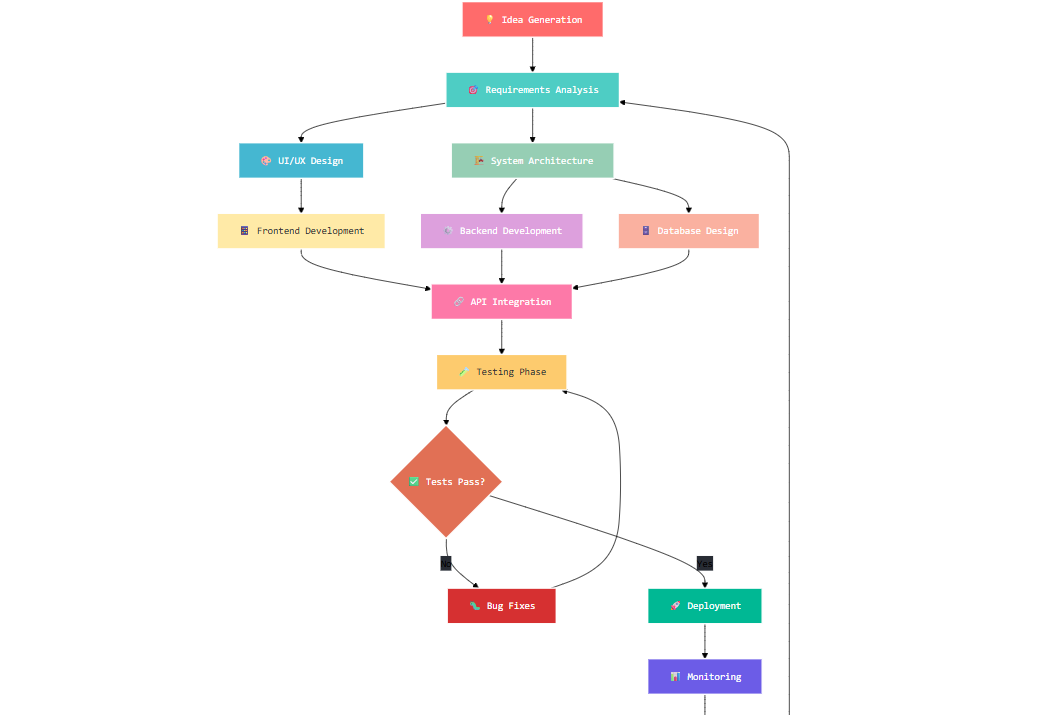
Technical System Visualization
- Software architecture diagrams
- Troubleshooting decision trees
- Data flow representations
- API integration mappings
Educational Materials
- Step-by-step tutorials
- Learning pathways
- Assessment flowcharts
- Course navigation guides
Decision Tree: Choosing the Right Level of Detail
I use this framework to determine the appropriate level of detail for any flowchart:
                    flowchart TD
                        Start[Define Audience] --> Tech{Technical Audience?}
                        Tech -->|Yes| Detail{Implementation Focus?}
                        Tech -->|No| Simple[Keep It Simple]

                        Detail -->|Yes| Full[Include All Technical Details]
                        Detail -->|No| Moderate[Balance Detail with Clarity]

                        Simple --> Purpose{Purpose?}
                        Purpose -->|Training| Step[Step-by-Step Detail]
                        Purpose -->|Overview| High[High-Level Only]
                        Purpose -->|Decision Making| Critical[Critical Paths Only]

                        Full --> Test[Test with Users]
                        Moderate --> Test
                        Step --> Test
                        High --> Test
                        Critical --> Test

                        Test --> Refine[Refine Based on Feedback]

                        style Start fill:#FF8000,stroke:#333,stroke-width:2px,color:#fff
                        style Refine fill:#66BB6A,stroke:#333,stroke-width:2px,color:#fff

My Tips for Maximum Clarity
These principles have consistently improved my flowchart effectiveness:
- Consistent symbol usage: Never deviate from standard symbols within a diagram set
- Strategic color coding: Use colors to represent process phases, not decoration
- Balance detail with readability: If you need a magnifying glass, it's too complex
- Test with actual users: What makes sense to you might confuse others
- Version clearly: Always date and version your flowcharts for reference
Choosing Your Flowchart Creation Path
After years of experience with both traditional and AI-powered tools, I've developed clear criteria for choosing the right approach for each project. Let me help you make the best decision for your needs.
When Canva Suffices
I still use Canva for simple, one-time diagrams where:
- The flowchart has fewer than 10 elements
- No updates or iterations are expected
- Static output is acceptable
- Team already has Canva licenses
Tool Selection Decision Matrix
Based on project requirements, here's how I decide between tools:
When to Upgrade Your Approach
I recommend considering advanced tools when you need:
- Dynamic, data-driven flowcharts that update automatically
- Regular creation of complex process documentation
- Truly interactive elements for user engagement
- Voice-to-visual rapid prototyping capabilities
- Integration with existing data sources
- Collaborative real-time editing with version control

Hybrid Approaches for Optimal Results
I've found the most success combining tools strategically:
- Start with voice input in PageOn.ai for rapid ideation and structure creation
- Refine with specific design elements that match your brand guidelines
- Export for various presentation formats depending on audience needs
- Use Canva for quick social media adaptations of complex flowcharts
Future-Proofing Your Visual Communication Strategy
Looking ahead, I'm focusing on:
- Embracing AI assistance without losing creative control over the narrative
- Building a library of reusable visual components for consistency
- Scaling from simple flowchart examples to enterprise-level documentation systems
- Training teams to think visually first, tools second
The key is understanding that tools like PageOn.ai don't replace creativity – they amplify it, allowing us to focus on strategy and storytelling rather than mechanical diagram construction.
Transform Your Visual Expressions with PageOn.ai
Ready to revolutionize how you create flowcharts? Experience the power of AI-driven visualization that turns your ideas into stunning, interactive diagrams in seconds. Join thousands who've already discovered the future of visual communication.
Start Creating with PageOn.ai TodayYou Might Also Like
The Ultimate Design Tools & Workflow Ecosystem for Creative Professionals
Discover essential design tools and optimized workflows for creative professionals. Learn how to build a cohesive ecosystem of visual tools that streamline ideation, feedback, and asset management.
Essential MCP Tools for Automated Slide Creation and Design | PageOn.ai
Discover essential Model Context Protocol (MCP) tools for automated slide creation and design. Learn how to transform presentation workflows with AI-powered automation.
Enhancing Audience Experience with Strategic Audio Integration | Create Immersive Brand Connections
Discover how strategic audio integration creates immersive brand connections across podcasts, streaming platforms, and smart speakers. Learn frameworks and techniques to transform your marketing.
Harnessing Creative Tension: Strategic Conflict in Experience Design | PageOn.ai
Discover how to intentionally use conflict as a creative catalyst in experience design. Learn techniques for implementing productive tension that transforms friction into innovative solutions.