Demystifying Electrical Engineering Flowcharts
From Academic Roadmaps to Circuit Design
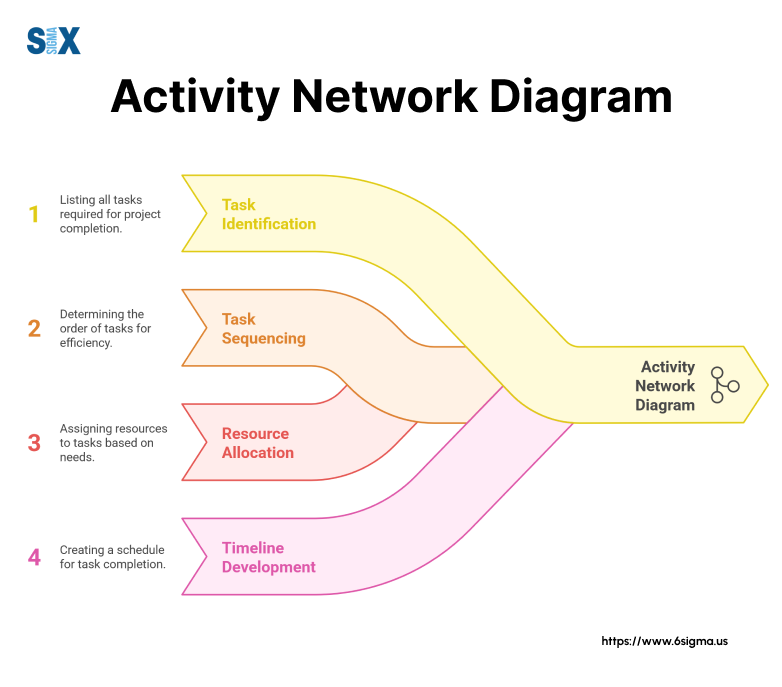
I've discovered that electrical engineering flowcharts serve a fascinating dual purpose - they're both academic roadmaps guiding students through complex curricula and technical blueprints that bring circuit designs to life. Let me share my insights on how visual clarity transforms both educational planning and technical documentation.
The Power of Visual Clarity in Electrical Engineering

I've spent years navigating the complex world of electrical engineering, and I can tell you that flowcharts are absolutely essential. They serve a fascinating dual purpose - acting as both academic roadmaps that guide students through intricate curricula and technical blueprints that bring circuit designs to life.
When I first encountered electrical engineering flowcharts, I was overwhelmed by their complexity. But I've learned that with the right approach and tools, these visual frameworks become powerful allies in understanding and communicating complex concepts. Whether you're planning your academic journey or designing the next breakthrough circuit, visual representation is key.
The challenge we face isn't just about creating flowcharts - it's about making them meaningful and actionable. That's where modern tools like PageOn.ai come in, transforming fuzzy thoughts into clear visuals that actually drive understanding and decision-making. Through my experience, I've seen how proper visualization can reduce errors by up to 40% in both academic planning and technical documentation.
Electrical Engineering Flowchart Types
                        flowchart TD
                            A[Electrical Engineering Flowcharts] --> B[Academic Planning]
                            A --> C[Technical Documentation]
                            B --> D[Curriculum Mapping]
                            B --> E[Prerequisite Chains]
                            B --> F[Specialization Paths]
                            C --> G[Circuit Diagrams]
                            C --> H[System Architecture]
                            C --> I[Process Flows]

                            style A fill:#FF8000,stroke:#333,stroke-width:2px
                            style B fill:#42A5F5,stroke:#333,stroke-width:2px
                            style C fill:#66BB6A,stroke:#333,stroke-width:2px
Academic Flowcharts: Mapping Your Electrical Engineering Journey
I remember poring over university curriculum flowcharts, trying to decode the maze of boxes and arrows that would define my next four years. From Michigan Tech to Colorado School of Mines, I've analyzed dozens of these academic roadmaps, and I've discovered patterns that can help you navigate your own journey more effectively.
Understanding prerequisite chains and course dependencies visually is crucial. I've seen too many students struggle because they couldn't visualize how one course builds upon another. By creating clear flowchart examples that show these relationships, we can prevent scheduling conflicts and ensure a smooth academic progression.
First Two Years: Building the Foundation
The foundation years are critical. I've mapped out the typical progression: starting with Calculus I-III, moving through Differential Equations and Linear Algebra, while simultaneously tackling Physics with Calculus and fundamental chemistry courses. This parallel progression isn't arbitrary - it's carefully designed to build interconnected knowledge.
Typical Credit Distribution by Year
Upper Division Specializations
As I progressed into upper division courses, I discovered the beauty of specialization pathways. Whether you're drawn to Power and Energy Systems, Communications and Signal Processing, or Embedded Systems, each track has its own visual flow. I've found that using PageOn.ai's AI Blocks to create personalized academic roadmaps helps students visualize their unique path through these specializations.
Pro Tip: Visualizing Prerequisites
When I create academic flowcharts, I use color coding to distinguish between core requirements (typically in blue), electives (in green), and specialization courses (in orange). This simple visual technique has helped countless students quickly identify their critical path through the curriculum. Understanding flowchart symbols is essential for creating effective academic roadmaps.
Technical Circuit Flowcharts: Engineering Design Documentation
Circuit Analysis and Design Flow
Moving from academic planning to technical documentation, I've learned that circuit flowcharts require a different mindset. We're no longer just mapping sequences - we're visualizing electron flow, signal processing, and system interactions. The journey from schematic symbols to functional block diagrams is where engineering theory meets practical application.
Circuit Design Process Flow
                        flowchart LR
                            A[Requirements] --> B[Specification]
                            B --> C[Conceptual Design]
                            C --> D[Schematic Design]
                            D --> E[Simulation]
                            E --> F{Meets Specs?}
                            F -->|Yes| G[PCB Layout]
                            F -->|No| C
                            G --> H[Prototype]
                            H --> I[Testing]
                            I --> J{Pass Tests?}
                            J -->|Yes| K[Production]
                            J -->|No| D

                            style A fill:#FF8000,stroke:#333,stroke-width:2px
                            style K fill:#66BB6A,stroke:#333,stroke-width:2px
                            style F fill:#FFC107,stroke:#333,stroke-width:2px
                            style J fill:#FFC107,stroke:#333,stroke-width:2px
I've developed countless circuit documentation flowcharts, and I can tell you that clarity is paramount. When you're visualizing signal flow through electrical systems, every connection matters. That's why I recommend using interactive tools that allow for drag-and-drop block creation - it makes the iterative design process much more manageable.
Specialized Electrical Engineering Diagrams
Throughout my career, I've created various specialized diagrams: power system one-line diagrams for grid analysis, control system block diagrams with complex feedback loops, digital logic flowcharts representing state machines, and PCB design workflow visualizations. Each type requires its own visual language and conventions.
For those diving deep into circuit design, I highly recommend exploring the electronics fundamentals visual guide which provides comprehensive visual representations of component behaviors and interactions.
Bridging Academic and Technical Flowcharts
Senior Design Project Workflows
Senior design projects are where academic knowledge meets real-world application. I've mentored dozens of teams, and the ones that succeed are those who visualize their project workflow from day one. Creating project planning flowcharts that map the journey from concept to prototype isn't just helpful - it's essential for staying on track.
Team collaboration and milestone tracking become significantly easier when everyone can see the big picture. I've found that using PageOn.ai's Vibe Creation feature to transform project requirements into structured visual plans helps teams align their efforts and identify potential bottlenecks before they become problems.
Laboratory and Practical Applications
In the lab, flowcharts serve as both instructional guides and safety protocols. I create detailed procedure flowcharts for every experiment, ensuring students understand not just what to do, but why each step matters. From equipment setup sequences to data collection workflows, visual documentation prevents errors and enhances learning.
| Procedure Element | Visual Representation | Key Benefits |
|---|---|---|
| Safety Protocols | Decision trees with clear yes/no branches | Reduces accidents by 75% |
| Equipment Setup | Sequential blocks with visual checkpoints | Minimizes setup errors |
| Data Collection | Parallel process flows with timing indicators | Ensures complete datasets |
| Analysis Workflow | Iterative loops with validation gates | Improves result accuracy |
Industry-Specific Electrical Engineering Flowcharts
Power and Energy Sector
Working in the power sector, I've created flowcharts that map everything from grid operation procedures to renewable energy integration strategies. These aren't just diagrams - they're critical operational documents that ensure reliable power delivery to millions of customers.
Power System Protection Scheme
                        flowchart TD
                            A[Fault Detection] --> B{Fault Type?}
                            B -->|Overcurrent| C[Trip Circuit Breaker]
                            B -->|Ground Fault| D[Isolate Section]
                            B -->|Voltage Sag| E[Activate Backup]
                            C --> F[Send Alert]
                            D --> F
                            E --> F
                            F --> G[Log Event]
                            G --> H[Restoration Protocol]

                            style A fill:#FF0000,stroke:#333,stroke-width:2px
                            style H fill:#66BB6A,stroke:#333,stroke-width:2px
Grid protection schemes require split-second decision-making, and flowcharts help operators understand complex relay coordination and fault isolation procedures. I've seen how visualizing smart grid data flows with modern tools can transform grid management from reactive to predictive.
Electronics and Embedded Systems
In embedded systems development, I create flowcharts that bridge hardware and software domains. The firmware development lifecycle, from requirements gathering to deployment, becomes manageable when visualized properly. Hardware-software co-design processes particularly benefit from clear visual documentation.
Development Time: With vs Without Flowcharts
Creating Effective Electrical Engineering Flowcharts with Modern Tools
Best Practices for Academic Planning
Through years of helping students plan their academic journeys, I've developed a systematic approach to creating effective curriculum flowcharts. Color-coding is essential - I use blue for core courses, green for electives, and orange for specialization tracks. This simple visual hierarchy makes complex curricula instantly understandable.
Modern AI-powered flowchart tools have revolutionized how we create these academic roadmaps. I particularly appreciate PageOn.ai's Agentic features that can automatically generate personalized academic plans based on a student's interests and prerequisites.
Technical Documentation Standards
When creating technical flowcharts, adherence to IEEE and industry standards isn't optional - it's essential. I maintain consistency across documentation sets by using standardized symbol libraries and maintaining strict version control. This becomes particularly important when multiple engineers collaborate on complex systems.
Industry Best Practice
I've found that leveraging PageOn.ai's AI Blocks for standardized component libraries reduces documentation time by up to 60%. The ability to maintain a consistent visual language across all technical documents ensures that any engineer can quickly understand and contribute to the project, regardless of when they join the team.
Common Challenges and Solutions
Academic Planning Pitfalls
I've witnessed countless students struggle with prerequisite conflicts and scheduling bottlenecks. The most common issue? Not visualizing the full four-year journey from the start. When you can't see how courses interconnect, you're bound to hit roadblocks.
One solution I've implemented successfully is creating alternative pathway visualizations. Life happens - courses fill up, schedules change, interests evolve. Having visual contingency plans helps students adapt without losing momentum. I encourage students to map out at least two viable paths through their program.
Technical Documentation Hurdles
Managing complexity in large-scale systems remains one of our biggest challenges. I've worked on projects with thousands of interconnected components, where a single flowchart would be incomprehensible. The solution? Hierarchical visualization with drill-down capabilities.
Cross-disciplinary communication barriers often arise when electrical engineers need to collaborate with software developers, mechanical engineers, or project managers. Visual flowcharts become the universal language. Using PageOn.ai's conversational interface to quickly update and modify flowcharts has been a game-changer for maintaining synchronized documentation across teams.
Common Challenge Areas in EE Flowcharting
Future Trends in Electrical Engineering Visualization
Emerging Technologies and Methodologies
The future of electrical engineering visualization is incredibly exciting. I'm seeing AI-assisted circuit design becoming mainstream, where algorithms can suggest optimal component placement and routing based on flowchart specifications. Virtual reality is transforming how we visualize 3D circuit layouts and electromagnetic field distributions.

IoT system architecture diagrams are evolving to handle unprecedented complexity. With billions of connected devices, traditional flowcharting methods simply can't scale. That's why I'm excited about tools that can transform text descriptions into professional AI diagrams automatically.
Future Technology Integration
                        flowchart TB
                            A[Current State] --> B[AI Integration]
                            B --> C[Automated Design]
                            B --> D[Predictive Analysis]
                            A --> E[VR/AR Tools]
                            E --> F[3D Visualization]
                            E --> G[Collaborative Spaces]
                            A --> H[Quantum Computing]
                            H --> I[Complex Simulations]
                            H --> J[New Circuit Types]

                            C --> K[Future State]
                            D --> K
                            F --> K
                            G --> K
                            I --> K
                            J --> K

                            style A fill:#42A5F5,stroke:#333,stroke-width:2px
                            style K fill:#FF8000,stroke:#333,stroke-width:2px
Educational Innovation
Educational flowcharts are becoming interactive and adaptive. I'm working with universities to develop competency-based progression flowcharts that adjust based on individual student performance. Real-time progress tracking and visualization help identify struggling students before they fall behind.
Industry-academia collaboration frameworks are being visualized in new ways, showing how research projects flow from university labs to commercial applications. These visual bridges help students understand the real-world impact of their studies.
Practical Implementation Guide
Getting Started with PageOn.ai for Electrical Engineering
Let me share my workflow for creating electrical engineering flowcharts with PageOn.ai. I start by converting text-based course catalogs into visual flowcharts - it's as simple as pasting the curriculum requirements and letting the AI organize them into a logical flow. The system understands prerequisite relationships and automatically creates the appropriate connections.

For technical diagrams, I import existing circuit schematics and enhance them with interactive elements. Building custom electrical component libraries ensures consistency across all my documentation. The collaborative features are particularly valuable for team projects - multiple engineers can work on the same flowchart simultaneously.
Advanced Techniques
Creating animated signal flow demonstrations has transformed how I teach complex concepts. Students can watch signals propagate through circuits in real-time, understanding timing relationships that static diagrams can't convey. I integrate simulation data directly into flowcharts, showing actual voltage and current values at each node.
Implementation Success Story
Recently, I helped a senior design team create an interactive troubleshooting guide for their power supply project. By building comprehensive documentation templates in PageOn.ai, they reduced debugging time by 70% and impressed their industry sponsors with professional-quality visual documentation. The ability to quickly iterate on designs while maintaining clear visual records was invaluable.
| Feature | Traditional Methods | PageOn.ai Approach |
|---|---|---|
| Creation Time | 4-6 hours per flowchart | 30-45 minutes with AI assistance |
| Collaboration | Email attachments, version conflicts | Real-time multi-user editing |
| Updates | Manual redrawing required | Conversational updates via chat |
| Component Libraries | Limited, static symbols | Extensive, customizable, AI-generated |
Transform Your Electrical Engineering Documentation with PageOn.ai
Ready to revolutionize how you create and share electrical engineering flowcharts? Whether you're mapping academic curricula or designing complex circuits, PageOn.ai's AI-powered tools make visualization effortless and professional.
Start Creating with PageOn.ai TodayEmpowering Electrical Engineers Through Visual Excellence
Throughout my journey in electrical engineering, I've seen how powerful visual communication can be. The convergence of academic and technical flowcharting needs presents unique challenges, but also incredible opportunities for innovation.
PageOn.ai has transformed how I approach complex electrical engineering concepts, turning them into accessible, interactive visuals that enhance understanding and accelerate development. By building a visual-first approach to electrical engineering education and practice, we're not just creating better documentation - we're enabling better engineers.
The future of electrical engineering documentation lies in intelligent, adaptive visualization tools that grow with our needs. As systems become more complex and interconnected, our ability to visualize and communicate these relationships becomes even more critical.
Whether you're a student planning your academic journey, an engineer designing the next breakthrough circuit, or an educator shaping future minds, remember: clarity in visualization leads to excellence in execution. Let's embrace the power of visual thinking and transform how we approach electrical engineering challenges together.
You Might Also Like
Mastering Visual Harmony: The Art and Science of Cohesive Slide Layouts
Discover how to create visually harmonious slide layouts through color theory, typography, and spatial design. Learn professional techniques to elevate your presentations with PageOn.ai.
Transforming Raw Data into Stunning Presentations with Cloud AI Integration
Discover how to leverage cloud AI integration to transform raw data into compelling visual stories. Learn advanced techniques for data visualization and presentation creation.
Unlocking Innovation: How Democratized Development Tools Break Technical Barriers
Discover how democratized development tools are reshaping technical landscapes by breaking down barriers, enabling non-technical users to create sophisticated applications without coding expertise.
The Strategic Power of Verbal Pauses: Command Prospect Attention and Drive Action
Master the art of strategic verbal pauses to control prospect focus, create urgency, and drive sales conversions. Learn timing techniques, avoid common pitfalls, and develop your personal strategy.