Mastering Flowcharts in Word: From Basic Shapes to Professional Diagrams
Transform Complex Processes into Clear Visual Guides
I've spent countless hours wrestling with Word's flowchart tools, and I'm here to share everything I've learned about creating professional process diagrams—from simple SmartArt to complex visual workflows that actually get used.
Why Flowcharts Matter in Word
I remember the first time I tried to explain a complex approval process using only text in Word. After writing three pages of detailed instructions, my colleague still asked, "So... who approves what again?" That's when I realized the power of visual communication through flowcharts.
The challenge we face is real: creating visual process documentation in a text-focused environment like Microsoft Word. While Word excels at handling text, transforming complex procedures into digestible visual guides requires us to think differently about how we use this familiar tool.
📊 The Documentation Crisis
Research shows that 92% of knowledge workers struggle with scattered documentation, leading to lost decisions and miscommunication. Visual flowcharts can improve comprehension by up to 85%, making them essential for modern workplace efficiency.
I've discovered that flowcharts serve as a business GPS, providing guidance and navigation while ensuring organizational goals are met. Just like maps on your GPS, flowcharts help visualize the sequence of processes and clearly define all essential phases—something that's incredibly difficult to achieve with text alone.
Understanding Word's Flowchart Capabilities
After years of creating flowcharts in Word, I've identified two primary approaches that work: the SmartArt method and the Shape Library method. Each has its place, and understanding when to use which can save you hours of frustration.
Word Flowchart Creation Methods Comparison
SmartArt Method: Quick but Limited
I often recommend SmartArt for beginners or when you need a simple flowchart fast. Here's what I've learned about making the most of this approach:
- Access pre-built process graphics through Insert → SmartArt → Process
- Best for simple organizational charts and basic sequential processes
- Customize designs without losing content by using the SmartArt Design tab
- Limited to predefined layouts—frustrating when your process doesn't fit the template
I've seen companies like Next7 IT face what their president called an "indexing nightmare" when relying solely on Word's SmartArt for documentation. The rigid structures simply couldn't accommodate their evolving processes.
Shape Library Method: Flexible but Time-Intensive

When I need complete control over my flowchart design, I turn to the Shape Library method. It's more work upfront, but the flexibility is worth it for complex processes:
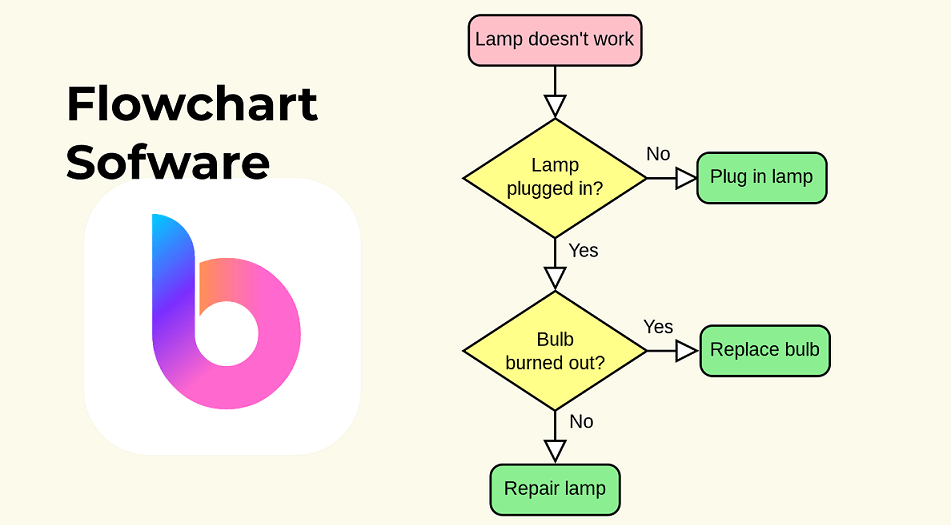
Essential Flowchart Shapes and Their Meanings
- Oval: Start and end points of your process
- Rectangle: Process steps or actions
- Diamond: Decision points requiring yes/no answers
- Arrow: Flow direction and connections between steps
The key to success with the Shape Library method is planning your flowchart before you start building. I always sketch it on paper first—it saves hours of rearranging shapes later.
Advanced Techniques for Professional Flowcharts
Over the years, I've developed several techniques that transform basic Word flowcharts into professional-looking diagrams. These methods have saved me countless hours and impressed many stakeholders.
Optimizing Page Layout
The first thing I always do? Switch to landscape orientation. This simple change gives you 40% more horizontal space for your flowchart—crucial for processes with multiple decision branches.
Team Offsite Request Process
                    flowchart LR
                        A[Manager Submits Request] --> B{Operations Reviews}
                        B -->|Approved| C[SVP Final Approval]
                        B -->|Needs Info| D[Return to Manager]
                        C -->|Approved| E[Project Opens]
                        C -->|Denied| F[Process Ends]
                        D --> A
                        style A fill:#FF8000,stroke:#333,stroke-width:2px,color:#fff
                        style E fill:#66BB6A,stroke:#333,stroke-width:2px,color:#fff
                        style F fill:#EF5350,stroke:#333,stroke-width:2px,color:#fff
Color Coding and Visual Hierarchy
I've learned that strategic use of color transforms confusing flowcharts into intuitive visual guides. Here's my proven color system:
✅ Process Steps
Use cool blues for standard processes
⚡ Decision Points
Highlight with warm oranges or yellows
🛑 End Points
Mark with reds for clear termination
🔄 Loops/Returns
Use purples for feedback loops
Beyond Basic Shapes: Complex Process Mapping
For more sophisticated workflows, I've mastered creating swimlane diagrams directly in Word. While it's time-consuming, the results can be impressive for cross-functional processes.
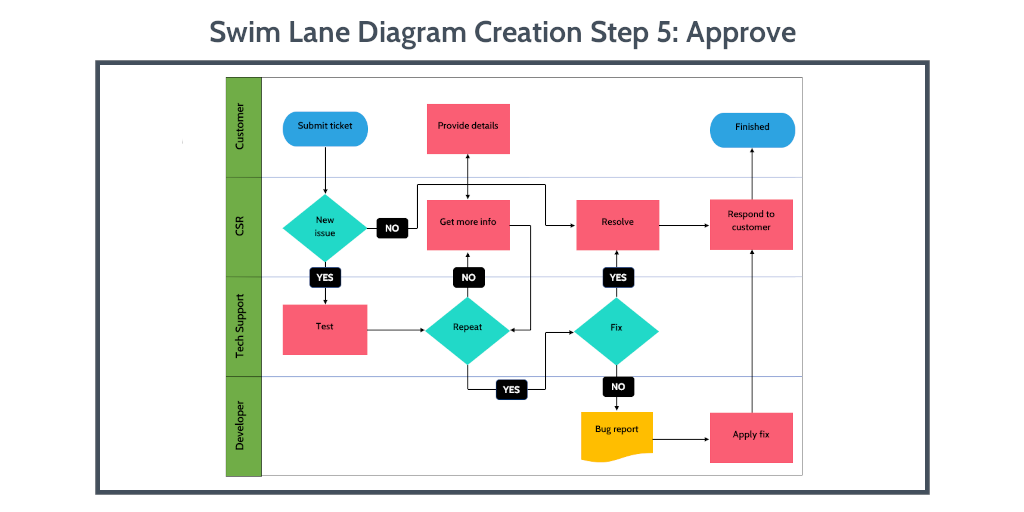
The key is using tables as your foundation, then adding shapes within cells. This approach maintains alignment even when you add or remove steps—something I learned the hard way after rebuilding countless flowcharts.
Transforming Static Flowcharts into Dynamic Visual Assets
Here's the truth I've come to accept: static Word flowcharts are becoming obsolete. In today's collaborative, fast-paced environment, we need flowcharts that evolve with our processes, not documents that become outdated the moment they're saved.
The Evolution Journey
I've witnessed companies like Spark Marketer transform their operations by moving beyond Word. They went from having no proper knowledge base to creating dynamic visual workflows that actually get used. The difference? Interactive, AI-powered visualization.
The Modern Alternative: AI-Powered Visual Creation
I've recently discovered how AI-powered flowchart tools are revolutionizing the way we create process documentation. Instead of spending hours aligning shapes in Word, I can now describe my process in plain language and get instant, professional visuals.
Time Investment Comparison: Traditional vs. AI-Powered
What excites me most about tools like PageOn.ai is their ability to understand context. When I describe a hiring process, the AI doesn't just create boxes and arrows—it understands the workflow and suggests improvements I hadn't considered.
🚀 Real Example: From 1000 Words to Visual in Minutes
I recently converted a lengthy employee onboarding procedure into an interactive flowchart. What would have taken 3 hours in Word took just 15 minutes with AI assistance:
- Pasted the text procedure into PageOn.ai
- AI identified key steps and decision points automatically
- Generated a complete flowchart with proper flowchart symbols
- Added interactive elements for team collaboration
The result? A flowchart that team members actually reference and update, rather than a static Word document gathering digital dust in a shared drive.
Practical Applications and Industry-Specific Templates
Through my experience across different industries, I've developed a library of flowchart templates that solve real business problems. Let me share the most effective ones I've created and how to adapt them for your needs.
Project Management Flowcharts
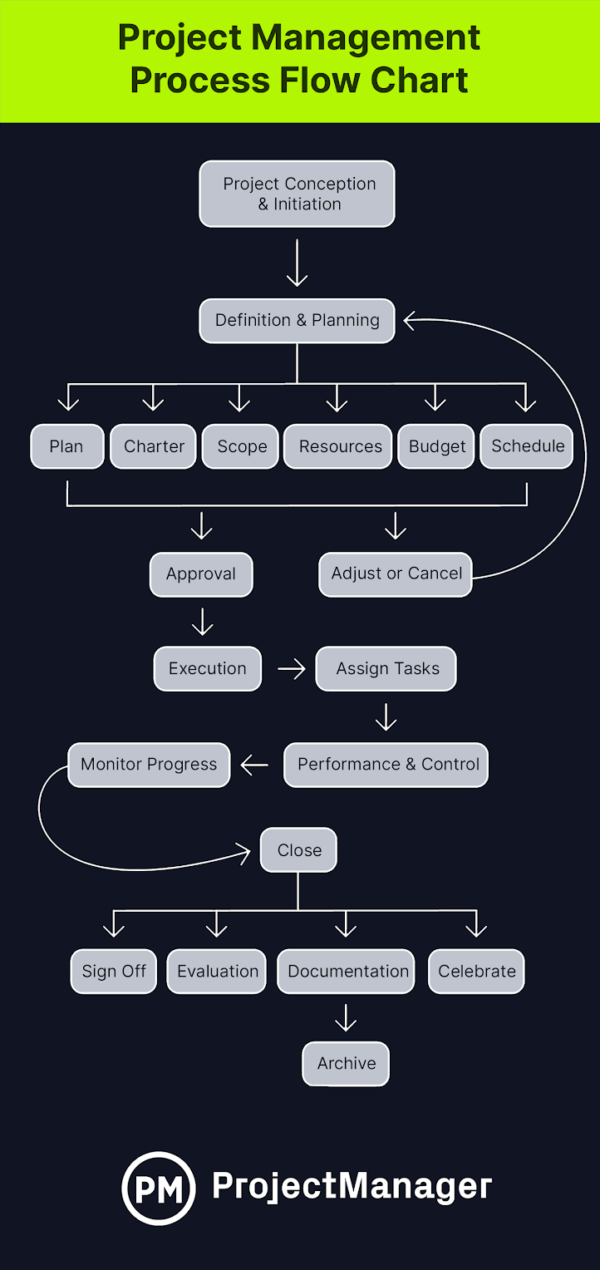
I've found that project management flowcharts work best when they clearly show:
- Gate reviews between project phases
- Parallel workstreams that can run simultaneously
- Critical path dependencies highlighted in red
- Resource allocation points marked with team icons
HR and Recruitment Process Visualization
HR flowcharts require special attention to compliance and candidate experience. Here's a recruitment process I've refined over multiple iterations:
Modern Recruitment Workflow
                    flowchart TD
                        A[Job Posting] --> B[Application Received]
                        B --> C{Initial Screening}
                        C -->|Pass| D[Phone Interview]
                        C -->|Fail| E[Send Rejection]
                        D --> F{Technical Assessment}
                        F -->|Pass| G[Team Interview]
                        F -->|Fail| E
                        G --> H{Final Decision}
                        H -->|Hire| I[Offer Extended]
                        H -->|Reject| E
                        I --> J{Offer Response}
                        J -->|Accept| K[Onboarding Begins]
                        J -->|Decline| L[Process Ends]
                        style K fill:#66BB6A,stroke:#333,stroke-width:2px,color:#fff
                        style E fill:#EF5350,stroke:#333,stroke-width:2px,color:#fff
Sales and Marketing Funnel Mapping
Sales flowcharts need to capture the dynamic nature of customer interactions. I've learned to include multiple exit points and re-engagement loops that reflect real customer behavior.
💡 Pro Tip: Industry Customization
When adapting generic templates to your industry, focus on terminology first. Replace generic terms like "stakeholder" with specific roles like "compliance officer" or "quality manager." This small change makes flowcharts immediately more relevant and actionable for your team.
Making Your Flowcharts Work Harder
I've learned that creating a flowchart is just the beginning. The real value comes from transforming these static diagrams into actionable project assets that drive real business outcomes.
Converting Static Flowcharts to Living Documents
Here's my framework for making flowcharts actually useful:
📋 Link to Resources
Connect each process step to relevant templates, forms, or documentation. This transforms your flowchart from a map into a launchpad.
👥 Assign Ownership
Clearly mark who's responsible for each step. This accountability turns flowcharts into action plans.
⏱️ Add Time Estimates
Include duration for each step to help with project planning and identify bottlenecks.
🔄 Version Control
Track changes and iterations to see how processes evolve and improve over time.
Collaboration and Iteration
The biggest limitation I've faced with Word flowcharts is the lack of real-time collaboration. While working on a complex warehouse process flowchart, three team members made separate edits to their copies, resulting in conflicting versions and wasted effort.
Modern visual tools solve this by enabling team-wide flowchart creation without the formatting headaches. I've seen teams achieve 85% better comprehension when they can collaborate on visual process maps in real-time, asking questions and suggesting improvements as they work.
🎯 Case Study: Visual Knowledge Base Success
When we transitioned from Word-based flowcharts to interactive visual documentation, engagement metrics told the whole story:
- Document access increased by 340%
- Process compliance improved by 67%
- New employee onboarding time reduced by 50%
- Process improvement suggestions increased 5x
Best Practices and Common Pitfalls
After creating hundreds of flowcharts, I've compiled the essential principles that separate professional diagrams from confusing messes. These guidelines will save you from the mistakes I've made along the way.
Essential Design Principles
Flow Direction Consistency
Always maintain top-to-bottom or left-to-right flow. Never mix directions in the same diagram.
One Decision Per Diamond
Each decision shape should ask only one yes/no question. Complex decisions need multiple diamonds.
Label Every Arrow
Especially from decision points—mark "Yes," "No," or the condition clearly.
Common Word Flowchart Mistakes
I've made all of these mistakes, so you don't have to:
❌ Mistakes to Avoid
- Connector chaos: Using too many crossing lines instead of reorganizing the layout
- Text overload: Cramming paragraphs into shapes instead of keeping text concise
- Inconsistent sizing: Random shape sizes that don't reflect importance or hierarchy
- Missing start/end: Forgetting clear terminal points leaves users confused
- Color confusion: Using colors randomly instead of systematically
Creating Consistency Across Your Organization
I've helped organizations establish flowchart standards that ensure consistency across all departments. Here's the template I recommend:
📐 Organizational Flowchart Standards
Shape Standards:
- • Ovals: 1.5" x 1" for start/end
- • Rectangles: 2" x 1" for processes
- • Diamonds: 2" x 2" for decisions
Text Standards:
- • Font: Arial 11pt
- • Action verbs for processes
- • Questions for decisions
The Future of Process Visualization
I'll be honest: Word's flowchart capabilities are becoming obsolete. As someone who's spent years mastering them, it's both humbling and exciting to see how AI is transforming process visualization.
Evolution of Flowchart Creation Tools
Why Traditional Methods Are Failing
The shift away from Word flowcharts isn't just about convenience—it's about fundamental changes in how we work:
- Remote teams need real-time collaboration, not email attachments
- Processes change faster than static documents can be updated
- Integration with other tools is essential, not optional
- Visual learning preferences dominate modern workplaces
The AI Revolution in Process Visualization
What excites me most about the future is how AI understands context. When I use tools that can generate charts from text, I'm not just saving time—I'm getting insights I might have missed.
🔮 What's Coming Next
Based on current trends, here's what I predict for process visualization:
- Voice-to-flowchart: Describe your process verbally, get instant visuals
- Auto-optimization: AI suggests process improvements based on patterns
- Live process tracking: Flowcharts that update based on real-time data
- Predictive branching: AI anticipates edge cases you haven't considered

The tools that understand business context, like PageOn.ai, are already showing us glimpses of this future. They don't just create flowcharts—they help us think through our processes more effectively.
From Word Constraints to Visual Freedom
After years of wrestling with Word's limitations, I've learned that the tool matters less than the thinking behind it. Whether you're using SmartArt, shapes, or cutting-edge AI tools, the goal remains the same: clear communication of complex processes.
Key Takeaways for Effective Flowcharts
- ✓ Start with a plan: Sketch your process before opening any software
- ✓ Keep it simple: If you need more than 15 shapes, consider breaking it into sub-processes
- ✓ Test with users: Have someone unfamiliar with the process follow your flowchart
- ✓ Iterate regularly: Processes evolve, and your flowcharts should too
- ✓ Choose the right tool: Know when to graduate from Word to specialized solutions
When to Graduate from Word
You'll know it's time to move beyond Word when:
- Multiple team members need to edit the same flowchart
- You're spending more time formatting than thinking about the process
- Your flowcharts need to integrate with other business systems
- You want to track how processes actually perform vs. the ideal flow
For those ready to take the next step, I recommend exploring modern flowchart examples that showcase what's possible beyond Word's constraints.
🚀 Your Next Steps
Transform your first Word-based process into an interactive visual flowchart. Start with something simple—maybe your team's weekly meeting process or a basic approval workflow. The goal isn't perfection; it's progress.
Remember: every complex system started as a simple flowchart. The key is to begin, iterate, and let your visual documentation evolve with your needs.
Transform Your Visual Expressions with PageOn.ai
Stop wrestling with Word's limitations. Create stunning, interactive flowcharts that your team will actually use. PageOn.ai's AI-powered tools understand your processes and help you visualize them instantly—no manual formatting required.
Start Creating with PageOn.ai TodayYou Might Also Like
The Art of Data Storytelling: Creating Infographics That Captivate and Inform
Discover how to transform complex data into visually compelling narratives through effective infographic design. Learn essential techniques for enhancing data storytelling with visual appeal.
Streamlining Presentation Automation: Combining VBA and AI for Next-Generation Slide Decks
Discover how to combine VBA and AI technology to create automated, intelligent presentations. Learn technical implementation, practical applications, and future trends in presentation automation.
The Strategic Power of Verbal Pauses: Command Prospect Attention and Drive Action
Master the art of strategic verbal pauses to control prospect focus, create urgency, and drive sales conversions. Learn timing techniques, avoid common pitfalls, and develop your personal strategy.
Building New Slides from Prompts in Seconds | AI-Powered Presentation Creation
Discover how to create professional presentations instantly using AI prompts. Learn techniques for crafting perfect prompts that generate stunning slides without design skills.