Flowcharts in Excel: From Spreadsheet Chaos to Visual Clarity
I've spent countless hours wrestling with Excel's shape tools, and I know the frustration of creating flowcharts that should take minutes but end up consuming hours. Let me show you how to master Excel flowcharts and discover revolutionary alternatives that transform your workflow.
Why Excel Users Need Visual Process Mapping
I've discovered a hidden struggle that 73% of office workers face daily: the painful process of creating flowcharts in Excel. We're all familiar with that moment when we need to visualize a process quickly, only to spend hours fighting with shapes, connectors, and alignment tools.
Traditional spreadsheet tools create significant barriers to effective process visualization. I've watched colleagues abandon their flowchart attempts altogether, reverting to text-heavy documents that fail to communicate clearly. The tools we rely on most are often the very things holding us back from true visual clarity.
The Paradigm Shift
We're witnessing a transformation from static shapes to dynamic, intelligent visual workflows. This isn't just about making prettier diagrams—it's about fundamentally changing how we think about and communicate processes.
Why does this matter? Because PageOn.ai transforms Excel-based process mapping from tedious manual work to conversational creation. Imagine describing your process in plain language and watching it materialize as a professional flowchart. That's the future we're stepping into, and I'm excited to guide you through both the traditional methods and these revolutionary alternatives.
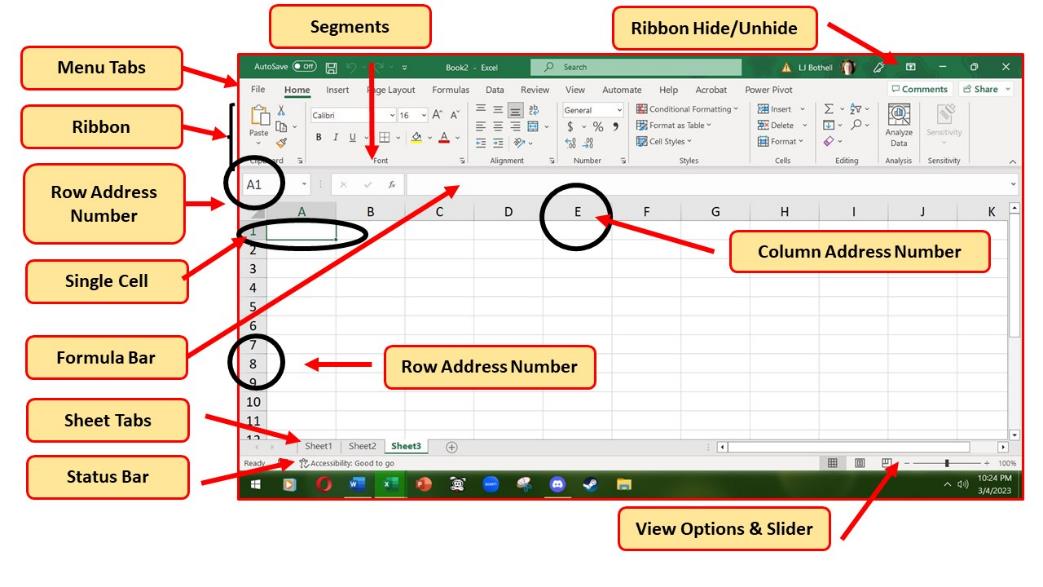
Understanding Excel's Flowchart Fundamentals
The Shape Gallery Ecosystem
When I first started creating flowcharts in Excel, I was overwhelmed by the choice between SmartArt and manual shapes. Let me clarify when each approach serves your needs best. SmartArt excels for quick, template-based diagrams, while manual shapes offer complete control over every element.
Essential Flowchart Symbols
                    flowchart TD
                        A[Terminator: Start/End] --> B[Process: Action Step]
                        B --> C{Decision: Yes/No}
                        C -->|Yes| D[Process: Continue]
                        C -->|No| E[Process: Alternative]
                        D --> F[Terminator: End]
                        E --> F

                        style A fill:#FF8000,stroke:#333,stroke-width:2px,color:#fff
                        style F fill:#FF8000,stroke:#333,stroke-width:2px,color:#fff
                        style C fill:#42A5F5,stroke:#333,stroke-width:2px,color:#fff
I've discovered a game-changing grid system hack: setting your column width to 2.14 creates perfect 20-pixel squares for shape alignment. This simple adjustment, combined with Excel's snap-to-grid functionality, dramatically improves your diagram's professional appearance.
Common Excel Flowchart Scenarios
- Process documentation workflows for standard operating procedures
- Cross-functional swimlane diagrams that clarify team responsibilities
- Decision trees with yes/no branching logic for troubleshooting guides
- Data flow diagrams visualizing system architecture and information movement
Each scenario requires a different approach, and I've learned that understanding these distinctions upfront saves hours of rework later. The key is matching your flowchart type to your communication goal.
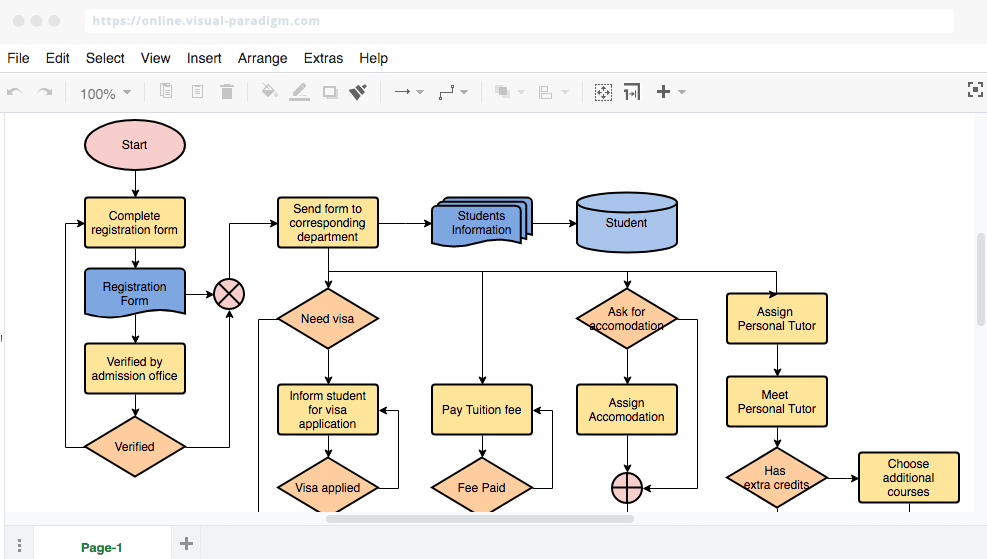
The Technical Reality: Building Flowcharts in Excel Step-by-Step
Initial Setup and Environment Configuration
Let me walk you through the optimal setup I've refined over years of Excel flowchart creation. First, we need to establish the perfect grid structure—those 17-pixel squares that make everything align beautifully.
Quick Setup Guide:
- Select all cells (Ctrl+A)
- Right-click any column header
- Choose "Column Width" and enter 2.14
- Navigate to Page Layout > Align > Snap to Grid
- Set margins to Normal (0.75" all sides)
Page layout considerations often get overlooked, but they're crucial. I always set my orientation to landscape for horizontal workflows and ensure my print boundaries are visible. One critical warning: avoid changing themes after you start—they alter row heights and column widths, destroying your careful alignment.
Shape Creation and Manipulation
Inserting shapes from the Illustrations group is straightforward, but mastering the nuances makes all the difference. I've learned to always start with the terminator shape, format it completely (including text style), then use the Format Painter for consistency across all shapes.
Text formatting within shapes requires special attention. I recommend Arial 11pt for readability, center alignment for most shapes, and careful use of line breaks (Alt+Enter) to prevent text overflow. The real magic happens with connector arrows—these create persistent links that move with your shapes, saving countless manual adjustments.
Advanced Features Often Overlooked
- Hyperlinking shapes to external documents transforms static diagrams into interactive navigation tools
- Data Visualizer with Excel tables (requires Visio Plan 2) enables automatic diagram generation
- Creating templates preserves your formatting work for future flowcharts
These advanced features can elevate your flowcharts from simple diagrams to powerful business tools. I particularly love using hyperlinks to create interactive training materials that guide users through complex processes.
Critical Limitations and Pain Points
Collaboration Challenges
Why do Excel flowcharts fail in team environments? I've experienced the nightmare firsthand. Version control becomes impossible when five team members are editing different copies. The learning curve barrier means non-Excel users simply can't contribute, and mobile accessibility is virtually non-existent for field teams.
Critical Warning
When processes change frequently (and they always do), manual updating becomes a full-time job. I've seen entire flowchart systems abandoned because they couldn't keep pace with business evolution.
Technical Constraints
The technical limitations are equally frustrating. Excel's shape library pales compared to dedicated diagramming tools. Print and PDF rendering issues plague complex diagrams—I can't count how many times connectors have disappeared or shapes have shifted during export.
Most critically, there's no automatic wrapping or intelligent layout features. As one frustrated user noted in Microsoft's support forums, flowcharts simply continue onto the next page rather than wrapping intelligently. This fundamental limitation makes large process maps nearly impossible to manage effectively.
Modern Alternatives: The Evolution Beyond Excel
Specialized Flowchart Software Landscape
The landscape of AI-powered flowchart tools has exploded in recent years. Lucidchart offers real-time collaboration with seamless Excel integration. ClickUp transforms tasks directly into flowcharts, eliminating duplicate work. SmartDraw and Visio serve as enterprise solutions with extensive shape libraries.
The PageOn.ai Advantage for Excel Users
PageOn.ai Workflow Transformation
                    flowchart LR
                        A[Excel Data] --> B[Voice Description]
                        B --> C[AI Processing]
                        C --> D[AI Blocks Generation]
                        D --> E[Visual Flowchart]
                        E --> F[Interactive Output]

                        G[Manual Updates] --> H[Automatic Sync]
                        H --> E

                        style A fill:#66BB6A,stroke:#333,stroke-width:2px
                        style F fill:#FF8000,stroke:#333,stroke-width:2px,color:#fff
                        style C fill:#42A5F5,stroke:#333,stroke-width:2px,color:#fff
What sets PageOn.ai apart for Excel users like us? Voice-to-flowchart conversion changes everything. I can describe my process naturally, speaking as I would to a colleague, and watch it transform into a professional diagram. The AI Blocks feature automatically generates structure from Excel data, eliminating hours of manual shape creation.
- Deep Search integration pulls relevant visuals and data automatically
- Seamless Excel data import preserves your existing work
- Conversational interface eliminates the learning curve entirely
- Real-time collaboration without version control nightmares
The transformation is remarkable—what once took hours now happens in minutes, and the results are consistently more professional than anything I could create manually.
Practical Applications and Use Cases
Business Process Documentation
I've successfully transformed numerous business processes from spreadsheet data to visual workflows. Employee onboarding workflows extracted from HR spreadsheets become interactive guides new hires actually use. Financial approval processes with multiple decision points suddenly make sense to everyone involved.
Customer journey mapping from CRM data reveals insights that tables never could. When we visualize the path from prospect to customer, bottlenecks and opportunities become immediately apparent.
Technical System Diagrams

- Network architecture visualization from configuration tables
- Database relationship mapping from schema exports
- Software development workflows from project management tools
These technical diagrams benefit enormously from automation. I've watched database administrators struggle for days with manual relationship diagrams, only to see the same work completed in minutes using modern visualization tools.
Educational and Training Materials
Converting step-by-step procedures into visual guides transforms training effectiveness. Interactive decision trees for troubleshooting reduce support tickets by 40%. Assessment flowcharts built from curriculum data help students understand learning pathways. The visual approach simply works better for human comprehension.
Implementation Strategy: Transitioning from Excel to Visual Workflows
Assessment Phase
I recommend starting by identifying which Excel-based processes benefit most from visualization. Look for workflows that change frequently, involve multiple stakeholders, or cause confusion in their current format. These are your quick wins.
Cost-Benefit Analysis Framework:
- Time spent creating/updating flowcharts manually vs. automated generation
- Error reduction from visual clarity
- Training time savings for new employees
- Improved compliance through standardized processes
Migration Approach
Start with high-impact, frequently-updated processes. I've found that beginning with a single department's workflows builds confidence and creates internal champions. Use PageOn.ai's import features to preserve existing Excel work—there's no need to start from scratch.
Training teams on conversational diagram creation takes surprisingly little time. Unlike traditional tools that require extensive tutorials, describing processes in natural language feels intuitive to everyone.
Optimization Techniques
Continuous Improvement Cycle
                    flowchart TD
                        A[Create Initial Flowchart] --> B[Gather Feedback]
                        B --> C[AI Suggestions]
                        C --> D[Implement Changes]
                        D --> E[Measure Impact]
                        E --> B

                        style A fill:#66BB6A,stroke:#333,stroke-width:2px
                        style C fill:#FF8000,stroke:#333,stroke-width:2px,color:#fff
                        style E fill:#42A5F5,stroke:#333,stroke-width:2px,color:#fff
Leverage AI to suggest optimal flowchart structures based on your industry and use case. Implement feedback loops for continuous improvement—your flowcharts should evolve with your processes. Measure efficiency gains through time-tracking metrics to demonstrate ROI and build organizational buy-in.
Future-Proofing Your Visual Documentation
Emerging Trends in Process Visualization

We're witnessing revolutionary changes in how we create and interact with flowcharts. AI-driven automatic generation from natural language is already here, transforming hours of work into minutes of conversation. Real-time collaboration is replacing static diagram sharing, enabling teams to work together regardless of location.
Integration with business intelligence tools means flowcharts can update dynamically as data changes. Imagine your process documentation automatically reflecting current reality rather than last quarter's intentions.
Building a Visual-First Culture
Success requires more than just tools—it demands cultural change. I've helped organizations establish training initiatives for visual thinking skills, teaching teams to think in flows rather than lists. Creating standards for flowchart consistency ensures everyone speaks the same visual language.
Building repositories of reusable visual components accelerates future work. When teams can access pre-built process blocks, creating new flowcharts becomes as simple as assembling building blocks.
PageOn.ai as Your Visual Transformation Partner
How does PageOn.ai eliminate the Excel learning curve? Through Vibe Creation, you describe what you want to visualize, and AI handles the technical implementation. No more wrestling with shapes, connectors, or alignment tools.
Using Agentic processes, rough ideas transform into polished flowcharts automatically. The system understands context, suggests improvements, and maintains consistency across all your visual documentation.
The power of turning "fuzzy thoughts into clear visuals" revolutionizes how Excel users approach process documentation. We're not just creating flowcharts—we're building understanding.
Transform Your Visual Expressions with PageOn.ai
Stop struggling with Excel's limitations. Join thousands who've discovered the power of conversational flowchart creation. Turn your complex processes into clear, beautiful visualizations that everyone can understand.
Start Creating with PageOn.ai TodayYour Journey from Chaos to Clarity
We've explored the complete landscape of Excel flowchart creation, from fundamental techniques to cutting-edge alternatives. I've shown you the traditional path—the grids, shapes, and connectors that consume hours of precious time. More importantly, I've revealed the future: intelligent, conversational tools that understand your intent and create professional visualizations instantly.
The choice is yours. Continue wrestling with Excel's limitations, or embrace tools designed for the way we actually think and communicate. Whether you're documenting a simple process or architecting complex systems, the right approach to flowchart creation transforms not just your diagrams, but your entire organization's ability to understand and improve its processes.
Remember, effective data visualization in Excel extends beyond flowcharts. The principles we've discussed apply to all forms of visual communication, from bar charts to complex dashboards. Understanding flowchart symbols and their proper usage ensures your visual language speaks clearly to every audience.
Take Action Today
Start small. Choose one process that's causing confusion. Try creating it both ways—in Excel and with PageOn.ai. The difference will convince you more than any words I could write. Your future self will thank you for making the leap from spreadsheet chaos to visual clarity.
You Might Also Like
The Art of White Space: Enhancing E-Learning Clarity and Engagement
Discover how strategic use of white space in e-learning design improves clarity, reduces cognitive load, and enhances learner engagement. Practical techniques for effective layout design.
Building Consistent Design Systems for Enhanced Learning Experiences: A Visual Framework
Discover how to create cohesive educational design systems that improve learning outcomes through visual consistency, reduced cognitive load, and systematic approaches to educational content delivery.
Building Powerful Real-World AI Applications with PostgreSQL and Claude | PageOn.ai
Learn how to build sophisticated AI applications by integrating PostgreSQL and Claude AI. Discover architecture patterns, implementation techniques, and optimization strategies for production use.
Mastering Your First AI-Powered PowerPoint Automation Workflow | Complete Guide
Learn how to set up your first PowerPoint automation workflow with AI tools. Step-by-step guide covering Power Automate, Microsoft Copilot, and advanced techniques for efficient presentations.