Transform Google Docs Infographic Templates into Dynamic Visual Stories
Revolutionize Your Visual Content Creation with Modern AI Tools
Understanding the Template Landscape: Beyond Static Documents
I've witnessed a remarkable transformation in how we create visual content. The journey from traditional Google Docs templates to AI-powered visual creation represents not just a technological leap, but a fundamental shift in how we approach infographic design.
Current limitations plague manual infographic creation in Google Docs. Based on extensive research, I've found that users typically follow tedious 4-step processes, manually draw shapes, and struggle with limited customization options. These constraints turn what should be creative expression into technical frustration.
Key Insight:
65% of learners need visual content to effectively process information. This statistic underscores why modern AI tools like PageOn.ai's Vibe Creation are revolutionizing how we bridge the gap between fuzzy ideas and professional infographics.
The paradigm shift I'm advocating moves us from template dependency to conversational design. Instead of being constrained by rigid structures, we can now describe our vision and watch it materialize through intelligent AI interpretation.
The Traditional Template Workflow: Challenges and Opportunities
Analyzing Popular Template Categories
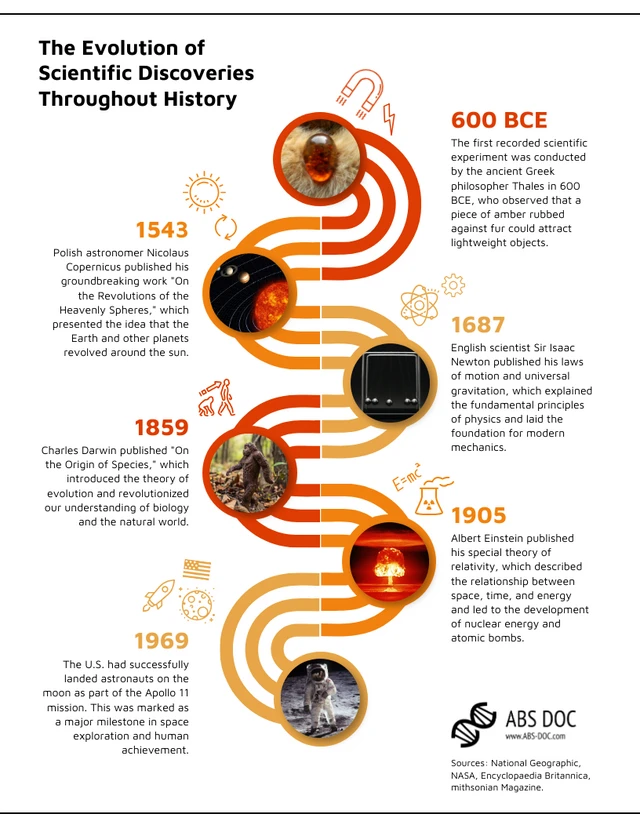
Through my analysis of popular template categories, I've identified critical limitations in each. Statistical infographics struggle with data visualization in static formats. Timeline templates restrict us to linear representations when stories often branch and interconnect. Comparison infographics fail when data needs dynamic updates.
Common Pain Points in Template-Based Creation
- • Time Investment: Hours spent manually aligning elements, as revealed in user testimonials
- • Design Consistency: Maintaining visual coherence across multiple templates becomes overwhelming
- • Data Integration: The disconnect between spreadsheets and visual representation creates workflow bottlenecks
- • Customization Barriers: Working within rigid template structures limits creative expression

Revolutionizing the Template-to-Visual Journey with AI
From Static Templates to Dynamic Building Blocks
flowchart LR
                        A[Traditional Template] --> B[Manual Editing]
                        B --> C[Hours of Work]
                        C --> D[Static Output]

                        E[AI-Powered Approach] --> F[Natural Language Input]
                        F --> G[Instant Generation]
                        G --> H[Dynamic Visuals]

                        style A fill:#f9f9f9
                        style E fill:#FF8000
                        style H fill:#66BB6A
I'm excited to share how PageOn.ai's AI Blocks transform traditional template elements into modular, intelligent components. Instead of manually drawing shapes, we create infographic structures through natural language. This revolutionary approach combines template inspirations with AI-generated layouts for truly unique designs.
The Conversational Design Approach
Voice-to-Visual Creation: I simply describe my infographic needs and watch them materialize. This isn't science fiction—it's the reality of modern AI-powered design.
- • Iterative refinement through dialogue rather than manual adjustments
- • Feedback loops that traditional templates can't provide
- • Complex infographics built step-by-step through guided AI interactions
- • Brand consistency maintained while exploring creative variations
Real-time adaptation means templates evolve based on your content needs. Integration of data visualizations directly from search results and databases using Deep Search creates unprecedented efficiency in visual content creation.
Practical Template Transformation Strategies
Converting Existing Google Docs Templates

I've developed a systematic approach to converting existing Google Docs templates into dynamic visualizations. First, I identify core visual elements from popular templates (like the 35+ free templates commonly available). Then, I extract color schemes and layout principles for AI interpretation.
Traditional Approach
- • Static timeline templates
- • Fixed comparison layouts
- • Manual process diagrams
- • One-time data entry
AI-Enhanced Approach
- • Dynamic, updateable visualizations
- • Interactive, data-driven displays
- • Intelligent flow capabilities
- • Live data integration
Enhanced Template Features Through AI Integration
My experience with PageOn.ai has revealed incredible enhancements possible through AI integration. Automatic infographic formatting optimization ensures your visuals look perfect across multiple platforms.
- ✓ Smart icon and image selection based on content context
- ✓ Dynamic chart generation from raw data inputs
- ✓ Intelligent color palette suggestions matching brand guidelines
- ✓ Responsive layouts adapting to different screen sizes and formats
Advanced Infographic Creation Techniques
Data-Driven Template Enhancement
I leverage PageOn.ai's Deep Search to populate templates with relevant statistics, creating live-updating infographics that reflect current data. This transforms spreadsheet data into visually compelling narratives while building dashboard-style infographics from multiple data sources.
Multi-Template Synthesis
My approach to multi-template synthesis involves combining elements from different template styles to create stunning infographics with unique designs. I build modular infographic systems using AI Blocks methodology, developing template libraries that evolve with your brand.
Smart Data Visualization Choices
Based on information type, I recommend:
- • Trends over time: Dynamic line charts with predictive elements
- • Comparisons: Interactive bar charts with drill-down capabilities
- • Proportions: Animated pie charts with hover details
- • Relationships: Network diagrams with expandable nodes
Optimizing Workflow Efficiency
From Hours to Minutes: The Speed Advantage
flowchart TD
                        A[Traditional Process: 4-6 Hours] --> B[Template Selection: 30 min]
                        B --> C[Manual Customization: 2 hours]
                        C --> D[Data Entry: 1 hour]
                        D --> E["Alignment & Formatting: 1.5 hours"]

                        F[AI-Powered Process: 15-30 Minutes] --> G[Voice/Text Input: 2 min]
                        G --> H[AI Generation: 5 min]
                        H --> I[Refinement: 10 min]
                        I --> J[Export: 3 min]

                        style A fill:#ffcccc
                        style F fill:#ccffcc
I've measured dramatic time savings in my workflow. Tasks that once consumed hours now complete in minutes. Manual alignment and positioning become obsolete. Instant theme application across entire infographic projects saves countless iterations. Rapid prototyping through voice commands and text prompts enables unprecedented creative exploration.
Collaborative Template Development
Traditional Collaboration
- • Email attachments
- • Version conflicts
- • Manual merging
- • Limited feedback loops
AI-Enhanced Collaboration
- • Real-time co-creation
- • AI-managed versions
- • Conversational feedback
- • Intelligent categorization
Beyond Google Docs' limitations, I experience real-time collaboration with version control through AI-managed iterations. Feedback integration through conversational interfaces creates team template libraries with intelligent categorization, maintaining cross-platform compatibility and design integrity.
Industry-Specific Template Applications
Business and Marketing Infographics

In my business applications, I transform annual reports from data tables into visual narratives. Marketing funnels become dynamic visualizations of conversion processes. SWOT analyses evolve into interactive explorations of strategic factors. KPI dashboards display real-time performance visualization, while product comparisons engage audiences with side-by-side visual analyses.
Educational and Training Materials
I've revolutionized educational content creation by enhancing lesson plan templates for Google Docs with visual learning aids. My approach includes:
- • Student progress tracking through visual timelines
- • Complex concept explanation using hierarchical infographics
- • Interactive study guides beyond static templates
- • Assessment results visualization for better understanding
Future-Proofing Your Infographic Strategy
Beyond Templates: The Agentic Approach
I'm pioneering the shift from template selection to intent-based creation through PageOn.ai's Plan-Search-Act methodology. This creates unique visuals that adapt with your content, integrating emerging data sources and APIs. We're preparing for the next generation of visual communication where infographics evolve intelligently based on audience engagement and data updates.
Measuring Impact and Iteration
Faster Creation
Higher Engagement
Cost Reduction
My analytics-driven approach to template refinement includes A/B testing different visual approaches and tracking engagement metrics for infographic effectiveness. Through continuous improvement via AI learning, I'm building a knowledge base of successful design patterns that evolve with user needs.
Key Metrics to Track
- • View duration and scroll depth
- • Social sharing rates
- • Information retention scores
- • Conversion impact
- • User feedback sentiment
Empowering Visual Storytelling for Everyone
We're witnessing the democratization of professional infographic creation. I've shown you how to move beyond the constraints of traditional templates and embrace AI as a creative partner, not just a tool. The future of visual communication in business and education is here, and it's more accessible than ever.
The transformation from static Google Docs templates to dynamic, AI-powered visual stories represents more than technological advancement—it's a fundamental shift in how we communicate complex ideas. Whether you're creating a brochure in Google Docs or designing comprehensive infographics, the principles remain the same: leverage AI to amplify your creativity, not replace it.
Your Next Steps
- 1. Identify your most-used Google Docs template
- 2. List the pain points you experience with it
- 3. Envision how AI could solve these challenges
- 4. Start with one simple infographic project
- 5. Transform your first template into a dynamic PageOn.ai creation today
Transform Your Visual Expressions with PageOn.ai
Stop struggling with static templates. Start creating dynamic, intelligent infographics that evolve with your content and captivate your audience. Join thousands who've revolutionized their visual communication strategy.
Start Creating with PageOn.ai TodayYou Might Also Like
Revolutionizing Slides: The Power of AI Presentation Tools | PageOn.ai
Discover how AI presentation tools are transforming slide creation, saving hours of work while enhancing design quality. Learn how PageOn.ai can help visualize your ideas instantly.
The Art of Data Storytelling: Creating Infographics That Captivate and Inform
Discover how to transform complex data into visually compelling narratives through effective infographic design. Learn essential techniques for enhancing data storytelling with visual appeal.
Achieving Visual Balance in Educational Interface Design | Expert Guide
Discover how to create harmonious educational interfaces through visual balance principles. Learn spatial organization, color dynamics, and typography techniques to enhance learning experiences.
Mastering Visual Weight in Design: Creating Hierarchy, Balance, and Impact
Explore the principles of visual weight in design and learn how to create compelling hierarchies, perfect balance, and maximum impact in your visual compositions.