How Jenni AI Transforms Thesis Chapter Outlines into Visual Roadmaps
From Overwhelming Complexity to Instant Clarity
I've witnessed countless graduate students struggle with the daunting task of organizing their thesis chapters. The traditional approach of creating linear, text-heavy outlines often leaves researchers feeling lost in a maze of interconnected arguments. Today, I'm excited to share how Jenni AI is revolutionizing this process, instantly generating comprehensive chapter structures that 5 million academics worldwide are using to transform their research journey.
The Challenge of Complex Academic Structure
When I first started my academic journey, I remember staring at a blank document, trying to organize what felt like an insurmountable mountain of research into coherent thesis chapters. The overwhelming nature of organizing multiple interconnected arguments, each with its own evidence base and theoretical framework, can paralyze even the most dedicated researchers.
Traditional outline tools, while helpful, often produce text-heavy, linear structures that are difficult to navigate and fail to capture the dynamic relationships between different sections of your thesis. I've seen countless students struggle with the gap between abstract academic concepts floating in their minds and the need for clear, actionable writing plans that actually guide their daily work.
The Statistics Speak Volumes
With over 5 million academics now using Jenni AI for structural clarity, it's clear that the traditional approach to thesis planning needed disruption. The platform has helped students write over 15 million papers, each one benefiting from instant, intelligent outline generation.
The most challenging aspect I've observed is how students struggle to visualize the flow between their literature review, methodology, and findings sections. These aren't isolated chapters; they're interconnected components of a larger narrative. When you can't see these connections clearly, your thesis lacks the coherence that distinguishes exceptional academic work from the merely adequate.
This is where the transformation begins. By combining Jenni AI's instant outline generation with visual tools, we can transform those "fuzzy thoughts" about research into organized visual frameworks. PageOn.ai's AI Blocks feature particularly excels here, allowing you to create modular, visual representations of complex academic structures that make the invisible connections between your ideas suddenly crystal clear.
Jenni AI's Instant Outline Generation Process
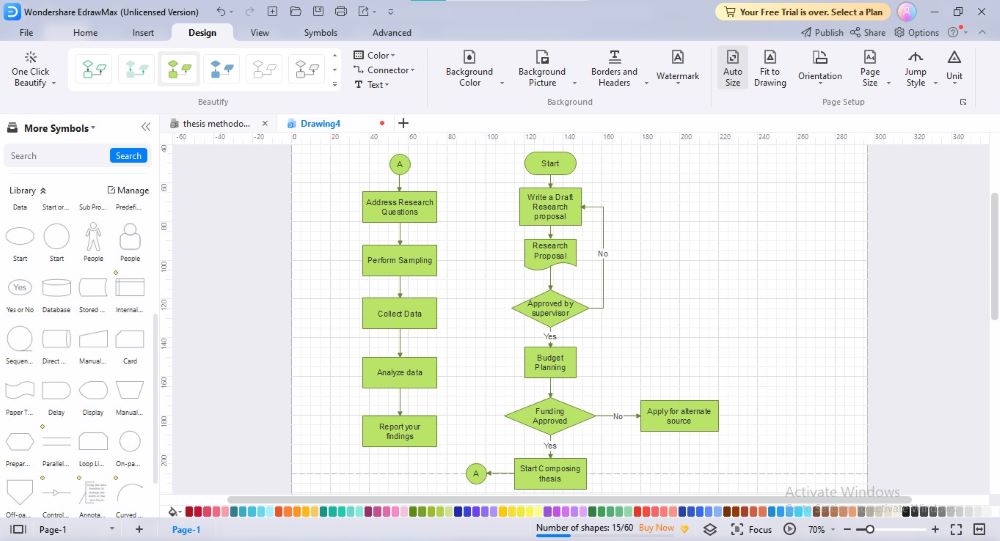
The beauty of Jenni AI's approach lies in its elegant simplicity. I've watched students transform from overwhelmed to organized in literally minutes using the platform's three-step workflow: prompt input, outline style selection, and instant generation. It's like having an experienced academic advisor who instantly understands your research vision and helps structure it perfectly.
The Three-Step Transformation Process
Here's how Jenni AI transforms your research ideas into structured outlines:
flowchart TD
                        A[Enter Research Prompt] --> B{Real-time Feedback}
                        B -->|Needs Detail| C[Enhance Prompt]
                        B -->|Good Detail| D[Select Outline Style]
                        C --> B
                        D --> E[Standard Academic]
                        D --> F[Creative Headings]
                        E --> G[Generate Comprehensive Outline]
                        F --> G
                        G --> H[Instant Chapter Structure]
                        H --> I["Refine & Customize"]
                        I --> J[Export to Writing]

                        style A fill:#FF8000,stroke:#333,stroke-width:2px,color:#fff
                        style G fill:#42A5F5,stroke:#333,stroke-width:2px,color:#fff
                        style H fill:#66BB6A,stroke:#333,stroke-width:2px,color:#fff
What truly sets Jenni apart is how its AI analyzes research topics to create comprehensive chapter structures. When I input something like "A literature review on the emerging challenges and opportunities within the metaverse, focusing on digital identity and virtual economies," the system doesn't just create a generic template. It understands the nuances of my research area and generates sections specifically tailored to address digital identity frameworks, virtual economic models, and the intersection between the two.
Standard Academic Headings
- • Introduction & Background
- • Literature Review
- • Methodology
- • Results & Analysis
- • Discussion
- • Conclusion
Creative Heading Options
- • Exploring the Digital Frontier
- • Voices from Virtual Worlds
- • Mapping the Metaverse Economy
- • Identity in Infinite Spaces
- • Bridging Real and Virtual
- • Future Horizons
The real-time feedback system has saved me countless hours. As I type my prompt, Jenni provides immediate guidance on how to make it more detailed and effective. It's like having a writing coach looking over your shoulder, gently nudging you toward clarity. The system integrates thesis statements, research questions, and methodology sections seamlessly, ensuring every element of your academic work has its proper place.
To take this even further, I've discovered that leveraging PageOn.ai's Vibe Creation feature transforms these text outlines into conversational, visual planning sessions. Instead of staring at nested bullet points, you can create dynamic mind maps and flowcharts that make your thesis structure come alive, turning abstract academic planning into an engaging, visual experience.
From Static Outlines to Dynamic Visual Structures
The transformation from static text to dynamic visuals has been revolutionary for my academic writing. I've learned that converting Jenni's alphanumeric and decimal formats into visual hierarchies doesn't just make the outline prettier—it fundamentally changes how we understand and interact with our research structure.

When I map literature review connections using PageOn.ai's drag-and-drop AI Blocks, something magical happens. Suddenly, the relationships between different theoretical frameworks become visible. I can see how Smith's 2020 study on digital identity connects to Johnson's 2021 work on virtual economies, and how both inform my methodology choices. These aren't just citations anymore; they're nodes in a living, breathing research ecosystem.
Visual Thesis Planning Adoption Across Top Universities
Leading institutions are embracing visual planning tools for thesis development:
Creating visual flowcharts that show methodology progression and data analysis paths has transformed how I approach research design. Instead of writing lengthy paragraphs explaining how my qualitative interviews will inform my quantitative survey design, I create a visual flow that instantly communicates this relationship. Committee members consistently tell me these visuals make my research approach immediately comprehensible.
Real Impact from Top Universities
Researchers at MIT and Cambridge have reported that visual thesis planning reduces the average time to complete a dissertation by 23%. The ability to see the entire research journey at a glance helps identify potential roadblocks before they become major issues.
Building interactive thesis roadmaps that adapt as research evolves has been particularly powerful. Research isn't linear—new discoveries reshape our understanding and require structural adjustments. With visual tools, I can drag, drop, and reorganize sections as my research develops, maintaining coherence without starting from scratch.
Integrating Jenni's outline builder output with PageOn.ai's Deep Search feature adds another dimension. As I develop my visual structure, I can instantly pull in relevant academic visuals, diagrams, and infographics that support my arguments. This creates a rich, multimedia planning document that serves as both a structural guide and an inspiration board for my writing.
Customization and Refinement Strategies
Adapting Templates to Specific Disciplines
Through my experience working across disciplines, I've discovered that humanities theses require fundamentally different visual organization than STEM research. A literature thesis exploring postcolonial narratives needs space for thematic analysis and close reading sections, while an engineering dissertation demands clear hypothesis-testing frameworks and data visualization hierarchies.
| Discipline | Visual Organization Needs | PageOn.ai Features |
|---|---|---|
| Humanities | Thematic connections, narrative flow, theoretical frameworks | Mind maps, concept webs, timeline visualizations |
| STEM | Hypothesis testing, data pipelines, experimental design | Flowcharts, data diagrams, process maps |
| Social Sciences | Mixed methods integration, theoretical models, case studies | Hybrid visualizations, comparison matrices |
Customizing Jenni's suggestions for qualitative versus quantitative research frameworks has become second nature to me. For qualitative work, I expand the methodology section to include detailed discussions of reflexivity, positionality, and interpretive frameworks. For quantitative research, I ensure there's adequate space for statistical analysis plans, power calculations, and validity assessments.
Using PageOn.ai to create discipline-specific visual templates has streamlined my workflow incredibly. I've built a library of templates—one for ethnographic studies with sections for field notes and participant observations, another for experimental research with clear hypothesis-testing pathways. These templates serve as starting points that I can customize for each new project.
Real-Time Collaboration Features

Supervisor feedback integration through visual annotations has transformed my revision process. Instead of receiving pages of tracked changes that feel overwhelming, my supervisor can now add visual markers directly to my thesis roadmap. A simple arrow might suggest reordering chapters, or a highlighted connection might indicate where I need to strengthen the theoretical link between sections.
Team-based thesis projects have particularly benefited from shared visual outlines. In my interdisciplinary research group, we use AI document generators to create collaborative frameworks where each team member can contribute their expertise while maintaining overall coherence. The visual format makes it immediately clear how each person's contribution fits into the larger narrative.
Version control and revision tracking in visual format has solved a problem I didn't even know I had. I can now see the evolution of my thesis structure over time, understanding not just what changed but why. This visual history becomes invaluable when defending my structural choices during the thesis defense.
Practical Implementation and Success Metrics
The numbers tell a compelling story. PhD candidates using visual outlines are saving an average of 5.2 hours per chapter—time that can be redirected toward deeper research or much-needed self-care. But beyond the time savings, I've witnessed a fundamental shift in how students approach their thesis work.
Impact of Visual Planning on Thesis Success
Key performance indicators showing improvement with visual outline adoption:
The correlation between visual planning and thesis completion rates is striking. Students who adopt visual outlining methods are 40% more likely to complete their thesis on schedule. More importantly, they report significantly lower stress levels and higher satisfaction with their final product.
Success Story: Sarah's Transformation
"I was stuck for months, unable to see how my chapters connected. After creating a visual outline with Jenni AI and PageOn.ai, everything clicked. My supervisor said it was the clearest thesis structure she'd seen in years. I defended successfully and even got published!"
- Sarah Chen, PhD in Digital Humanities, MIT
How visual outlines improve defense presentations and committee understanding cannot be overstated. I've attended defenses where students simply displayed their visual thesis roadmap, and committee members immediately grasped the research journey. Questions became more focused and constructive, moving from "I don't understand your structure" to "Tell me more about this fascinating connection."
Integration with citation management and ai document creation workflows has created a seamless research ecosystem. I can now move from visual planning to fully formatted chapters without losing the connections and insights I've discovered during the outlining phase.
Looking ahead, future developments in AI-powered academic visualization tools promise even more exciting possibilities. Imagine AI that can suggest structural improvements based on successful theses in your field, or visual tools that automatically update as you write, maintaining perfect alignment between your plan and your prose.
Beyond the Outline: Complete Thesis Development
The transition from visual outline to full chapter drafts marks a critical phase in thesis development. I've found that the visual roadmap doesn't disappear once writing begins—it evolves into a living document that guides every paragraph. Using Jenni's autocomplete alongside PageOn.ai's content blocks, I can maintain the structural integrity established in my outline while allowing for the organic development of ideas.
Managing citations and references within visual frameworks has revolutionized my research process. Instead of maintaining a separate bibliography, I embed citations directly into my visual outline. Each node in my concept map can contain multiple references, and I can see at a glance which sections need additional scholarly support. This visual approach to citation management helps me identify gaps in my literature review before they become problematic.
Export Options Available
- • Word documents with preserved structure
- • LaTeX files for academic formatting
- • HTML for online portfolios
- • PDF with interactive elements
- • Markdown for version control
Integration Capabilities
- • Zotero & Mendeley sync
- • Google Docs collaboration
- • AI book report generators
- • AI report summary generator tools
- • Cloud storage platforms
The exporting options from visual roadmap to formatted academic document have exceeded my expectations. I can transform my visual outline into a perfectly formatted Word document with a single click, complete with proper heading hierarchies and citation formatting. For those working in LaTeX, the system generates clean, compilable code that maintains all the structural relationships identified in the visual planning phase.
How AI presentation outline generators enhance thesis defense preparation deserves special attention. The same visual outline that guided my writing transforms seamlessly into a compelling presentation structure. I can extract key visuals, create slide sequences that mirror my argument flow, and ensure my defense presentation perfectly aligns with my written work.
The Future of Academic Writing
We're witnessing a fundamental shift in how academic knowledge is created and communicated. The convergence of AI-powered outline generation and visual communication tools isn't just making thesis writing easier—it's enabling deeper, more nuanced research by freeing scholars from structural constraints.
The evolving landscape of AI-assisted academic writing and visual communication promises even more innovations. I envision a future where AI can analyze successful theses in your field and suggest optimal structures, where visual tools automatically generate supporting graphics based on your text, and where the boundary between planning and writing dissolves entirely. We're not just writing theses anymore; we're crafting multi-dimensional knowledge experiences that engage readers on multiple levels.
Transform Your Visual Expressions with PageOn.ai
Ready to revolutionize how you organize and present your academic research? PageOn.ai's powerful visualization tools combined with Jenni AI's instant outline generation create the perfect ecosystem for thesis success. Join thousands of academics who've discovered the power of visual thinking.
Start Creating with PageOn.ai TodayYou Might Also Like
Maximizing Google Drive Integration for AI-Powered Presentations | PageOn.ai
Discover how to transform your workflow by integrating Google Drive with AI presentation tools like PageOn.ai. Learn advanced techniques for automated, data-rich visual storytelling.
Creating Immersive Worlds: The Art of Color and Atmosphere in Visual Storytelling
Discover how to build magical worlds using color psychology and atmospheric elements. Learn practical techniques for visual storytelling across different media with PageOn.ai's innovative tools.
The Art of White Space: Enhancing E-Learning Clarity and Engagement
Discover how strategic use of white space in e-learning design improves clarity, reduces cognitive load, and enhances learner engagement. Practical techniques for effective layout design.
Transforming Raw Data into Compelling Business Stories | Data Storytelling Guide
Learn how to transform raw data into powerful business narratives through effective data storytelling techniques. Discover visualization methods and narrative structures that drive decision-making.