The Future of Online Flowchart Creation
How AI and Visual Intelligence Are Transforming Process Mapping
I've spent over a decade watching the evolution of digital diagramming tools, from clunky desktop software to today's AI-powered online flowchart makers. What once took hours of manual drawing now happens in minutes through intelligent automation and real-time collaboration. Let me share what I've discovered about the tools that are reshaping how we visualize complex processes.
The Evolution of Digital Flowcharting
I remember my first encounter with flowchart software in the early 2000s – it was Microsoft Visio on a bulky desktop computer, and creating even a simple process diagram felt like wrestling with an octopus. Fast forward to today, and I'm watching teams of developers in San Francisco collaborate with designers in Tokyo, all working on the same flowchart in real-time through their browsers.
The transformation has been remarkable. What started as simple drawing tools has evolved into sophisticated platforms serving over 15 million users worldwide. These modern online flowchart makers aren't just about creating boxes and arrows anymore – they're about transforming how we think, communicate, and solve problems visually.
Key Insight: The shift from desktop to cloud-based flowchart tools has democratized visual communication. Today, anyone with a browser can create professional diagrams that once required expensive software and extensive training.
In my work with marketing agencies and software teams, I've seen firsthand how critical flowcharts have become in modern business. Whether it's mapping out a complex software architecture or visualizing a marketing campaign's customer journey, the ability to quickly create and share visual representations of processes has become indispensable. This is where PageOn.ai's philosophy of "Turn Fuzzy Thought into Clear Visuals" truly resonates – it addresses the fundamental challenge we all face: translating the complexity in our heads into something others can understand at a glance.
The Modern Flowchart Maker Landscape
After testing dozens of flowchart tools over the years, I've identified what truly sets the leaders apart from the pack. It's not just about having the most features – it's about having the right features implemented thoughtfully.
Core Capabilities Every Professional Tool Must Have
🔄 Real-Time Collaboration
Multiple team members editing simultaneously with live cursor tracking and instant synchronization
🌐 Cross-Platform Access
Works seamlessly across Windows, Mac, Linux, and mobile devices for universal accessibility
📚 Extensive Templates
Libraries with 70+ diagram types and over 4,500 pre-built templates to jumpstart any project
📊 Data Integration
Direct connections to Google Sheets, Excel, and CSV files for dynamic, data-driven diagrams
Pricing Tiers Across Leading Platforms
The integration ecosystem has become a crucial differentiator. I've found that tools with native connections to Microsoft 365, Google Workspace, Slack, and Atlassian products significantly reduce friction in daily workflows. What excites me about PageOn.ai's Deep Search feature is how it could revolutionize asset integration in flowcharts – imagine automatically pulling in relevant images, icons, and data without leaving your canvas.
AI-Powered Innovation: The New Frontier

The integration of AI into flowchart creation isn't just an incremental improvement – it's a paradigm shift. I recently watched a junior developer describe a complex authentication flow in plain English, and within seconds, an AI-powered tool generated a complete, properly formatted flowchart. What would have taken an hour was done in under a minute.
Tools leveraging AI-powered flowchart creation are transforming how we approach visual documentation. The magic happens through natural language processing that understands context and intent, not just keywords.
AI Transformation Process
                    flowchart LR
                        A[Text/Voice Input] --> B[AI Processing]
                        B --> C[Context Analysis]
                        C --> D[Layout Generation]
                        D --> E[Visual Flowchart]
                        E --> F[User Refinement]
                        F --> G[Final Output]

                        style A fill:#FF8000,stroke:#333,stroke-width:2px,color:#fff
                        style G fill:#66BB6A,stroke:#333,stroke-width:2px,color:#fff
PageOn.ai's Unique Approach: Vibe Creation
What sets PageOn.ai apart is its "Creation is Conversation" paradigm. Instead of learning complex software interfaces, you simply describe what you want to visualize. The platform's Vibe Creation feature converts voice or text descriptions directly into structured visual flows, eliminating the traditional learning curve entirely.
I've seen this approach reduce diagram creation time by up to 70%, particularly for non-technical team members who previously struggled with traditional flowchart tools.
The productivity gains are measurable and significant. Automatic data visualization from imported spreadsheets means no more manual recreation of process flows. Smart shape prediction learns from your patterns, suggesting the next logical element in your diagram. It's like having an experienced designer sitting next to you, anticipating your needs.
Essential Features and Symbols
Understanding flowchart symbols is fundamental to creating effective diagrams. I've trained dozens of team members over the years, and mastering these basic building blocks is always the first step.
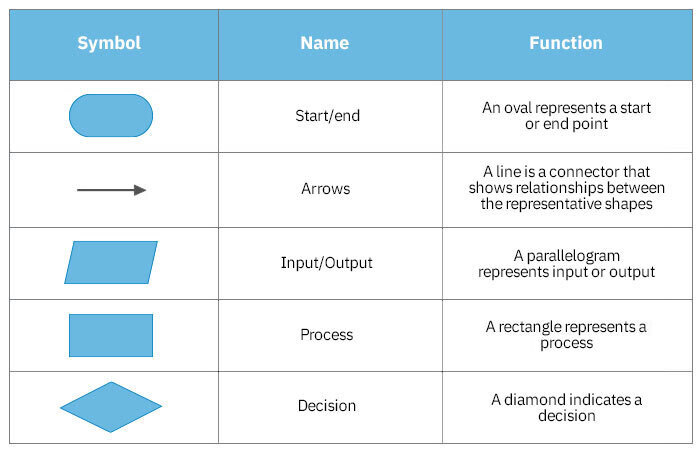
Standard Symbol Library
- ⭕ Ovals: Start and end points of any process
- ▭ Rectangles: Process steps and actions
- ◆ Diamonds: Decision points requiring yes/no answers
- ▱ Parallelograms: Input/output operations
Advanced Diagramming Elements
- 🏊 Swimlanes: Cross-functional process visualization
- 📋 BPMN: Business process modeling notation
- 🌐 Network Diagrams: System architecture visualization
- 🔄 Data Flow: Information movement tracking
PageOn.ai's AI Blocks Advantage
Think of AI Blocks as LEGO pieces for visual creation. Each block represents a concept, process, or data point that can be assembled with drag-and-drop simplicity. The intelligent snapping ensures perfect alignment, while dynamic content blocks update automatically when underlying data changes. It's the perfect blend of simplicity and power.
Real-World Applications and Use Cases
Over my decade in the industry, I've seen flowcharts solve problems across every imaginable domain. Let me share some flowchart examples that demonstrate their versatility.
Software Development Teams
I worked with a fintech startup that used Terrastruct to document their entire microservices architecture. The ability to create layered diagrams meant they could show high-level system interactions for executives while maintaining detailed technical flows for developers. Their deployment errors dropped by 40% after implementing visual documentation standards.
- System architecture documentation with version control
- API flowcharts showing request/response cycles
- Database relationship diagrams with live data connections
Marketing and Creative Agencies
My favorite success story comes from a digital agency that transformed their campaign planning using visual tools. They created interactive customer journey maps that clients could explore, clicking through different touchpoints to understand the strategy. Approval rates increased by 60% because stakeholders could finally "see" the plan.
- Campaign planning with multi-channel touchpoints
- Content workflow visualization across teams
- Client presentations with interactive elements
Enterprise Process Management
Large organizations face unique challenges. I consulted for a Fortune 500 company that used SmartDraw to standardize their process documentation across 50+ departments. The key was finding a tool that balanced power with accessibility – complex enough for IT architects, simple enough for HR managers.
- Organizational charts with automatic updates from HR systems
- IT audit flowcharts for compliance documentation
- Customer service workflow optimization
Collaboration and Team Dynamics
The shift to remote work has fundamentally changed how teams collaborate on visual projects. I've managed distributed teams across three continents, and the right collaboration features can make or break productivity.
Collaboration Feature Adoption Rates
Real-Time Collaboration Features
Multiple Cursors
See exactly what each team member is working on with color-coded cursors and name tags
Instant Sync
Changes appear immediately for all viewers, eliminating version conflicts
Contextual Comments
Leave feedback directly on specific elements with @mentions for notifications
Guest Access
Share with clients without requiring subscriptions (varies by platform)
PageOn.ai's Agentic Approach
What excites me about PageOn.ai's collaboration model is the Plan-Search-Act methodology. Instead of just sharing static diagrams, teams can collaborate on the thinking process itself. The platform automatically discovers and integrates relevant assets, maintaining visual consistency through shared libraries. It's like having an AI assistant that understands your team's visual language and helps everyone speak it fluently.
Choosing the Right Online Flowchart Maker
After years of helping teams select the right tools, I've developed a decision framework that cuts through the marketing noise and focuses on what actually matters for your specific needs.
| User Type | Recommended Tools | Price Range | Key Features |
|---|---|---|---|
| Individual/Small Teams | Draw.io, Canva, Creately | Free - $5/month | Basic diagrams, templates, sharing |
| Growing Teams | EdrawMax, Mermaid Chart | $6-16/month | AI features, collaboration, data sync |
| Enterprise | Lucidchart, Visio, SmartDraw | $15-25/user/month | Advanced security, integrations, support |
| Specialized Needs | Moqups (UX), Miro (Remote), PageOn.ai (Rapid) | Varies | Industry-specific features |
Pro Tip: Start with Your Constraints
I always advise teams to list their non-negotiables first. If you're a Windows-only shop, Visio might be perfect. If you need to create comparison charts alongside flowcharts, look for tools with diverse visualization capabilities. For rapid prototyping and ideation, PageOn.ai's conversational approach could save hours of design time.

Future Trends and Market Evolution
Looking ahead, I see three major trends reshaping the flowchart software landscape. These aren't just incremental improvements – they're fundamental shifts in how we create and interact with visual information.
Evolution of Flowchart Technology
                    flowchart TD
                        A[Current State 2024] --> B[Emerging Tech 2025]
                        B --> C[Voice Control]
                        B --> D[AR/VR Visualization]
                        B --> E[Auto-Execution]

                        C --> F[Future State 2026+]
                        D --> F
                        E --> F

                        F --> G[Unified Platforms]
                        F --> H[Intelligent Automation]
                        F --> I[Immersive Collaboration]

                        style A fill:#FF8000,stroke:#333,stroke-width:2px,color:#fff
                        style F fill:#42A5F5,stroke:#333,stroke-width:2px,color:#fff
                        style G fill:#66BB6A,stroke:#333,stroke-width:2px,color:#fff
                        style H fill:#66BB6A,stroke:#333,stroke-width:2px,color:#fff
                        style I fill:#66BB6A,stroke:#333,stroke-width:2px,color:#fff
Emerging Technologies
Voice-Controlled Creation
Imagine describing a complex process verbally while the AI creates the flowchart in real-time, asking clarifying questions as needed.
AR/VR Visualization
3D flowcharts you can walk through, manipulating connections with hand gestures in virtual space.
Automated Workflow Execution
Flowcharts that don't just document processes but actually execute them, bridging design and implementation.
The rise of AI chart generators is just the beginning. We're moving toward a future where the barrier between thought and visual expression disappears entirely.
The PageOn.ai Vision
What resonates with me about PageOn.ai's approach is their focus on democratizing visual communication. By treating creation as conversation, they're removing the technical barriers that have historically limited who can create professional visualizations.
Their vision of breaking down barriers between thought and visual expression isn't just about making flowcharts easier to create – it's about fundamentally changing how we communicate complex ideas. When anyone can transform a fuzzy thought into a clear visual in seconds, the implications for education, business, and creativity are profound.
As we look toward 2025 and beyond, the convergence of AI, real-time collaboration, and immersive technologies will create possibilities we can barely imagine today. The tools that succeed will be those that balance power with simplicity, automation with control, and individual creativity with team collaboration.
Transform Your Visual Expressions with PageOn.ai
Ready to experience the future of visual communication? PageOn.ai combines the power of AI with intuitive design tools to help you create stunning flowcharts, diagrams, and visualizations in minutes, not hours. Join thousands of professionals who are already transforming their fuzzy thoughts into crystal-clear visuals.
Start Creating with PageOn.ai TodayMy Final Thoughts
After spending countless hours testing, implementing, and teaching flowchart tools, I'm convinced we're at an inflection point. The traditional barriers – cost, complexity, and collaboration challenges – are rapidly disappearing. Modern online flowchart makers have evolved from simple drawing tools into sophisticated platforms that amplify our ability to think visually and communicate effectively.
Whether you're a solo entrepreneur mapping out your first business process or an enterprise architect designing complex systems, there's never been a better time to embrace visual communication. The tools are more powerful, more accessible, and more intelligent than ever before.
My advice? Start simple. Pick a tool that matches your current needs but has room to grow with you. And remember, the best flowchart isn't the one with the most features – it's the one that clearly communicates your ideas and helps others understand your vision. In that pursuit, platforms like PageOn.ai that prioritize clarity and ease of use over complexity might just be the key to unlocking your team's visual communication potential.
You Might Also Like
Mastering the Five Essential Sales Tonalities for Top Performance | PageOn.ai
Master the five essential sales tonalities - curious, confused, concerned, challenging, and playful - to transform your conversations and achieve top sales performance.
Essential MCP Tools for Automated Slide Creation and Design | PageOn.ai
Discover essential Model Context Protocol (MCP) tools for automated slide creation and design. Learn how to transform presentation workflows with AI-powered automation.
Advanced Image Masking Techniques for Creative Slide Design | PageOn.ai
Discover advanced image masking techniques to transform ordinary presentation slides into visual masterpieces. Learn creative approaches for PowerPoint, Google Slides, and Keynote.
Google Gemini Evolution: From Basic to Advanced Reasoning Models | Visual Timeline
Explore the complete visual evolution timeline of Google Gemini AI, from its foundation to revolutionary reasoning capabilities. See how Gemini transformed from basic to advanced models.