Mastering Swimlane Flowcharts: Transform Complex Processes into Crystal-Clear Visual Maps
Discover how swimlane diagrams revolutionize process visualization by showing not just what happens, but who makes it happen – creating instant accountability and clarity across your organization.
Why Swimlane Flowcharts Matter
When I first encountered swimlane flowcharts, I was struck by their elegant simplicity. Unlike traditional flowcharts that merely show what happens, swimlanes reveal the crucial dimension of who does what – instantly transforming abstract processes into accountable, actionable workflows.
The swimming pool metaphor isn't just clever – it's transformative. Just as swimmers stay in their designated lanes while moving toward a common goal, team members maintain clear responsibilities while contributing to the overall process. This visual accountability eliminates the all-too-common refrain of "I thought someone else was handling that."
Key Insight: Swimlane diagrams solve three critical challenges that plague complex organizations: lost tasks falling through the cracks, unclear handoffs between departments, and hidden bottlenecks that slow everything down.
I've found that choosing swimlanes over other flowchart examples makes the most sense when you need to visualize cross-functional processes, clarify ownership across teams, or identify where work gets stuck between departments.
Core Components and Visual Architecture
Understanding the building blocks of swimlane diagrams is essential for creating effective visual process maps. Let me walk you through the fundamental elements that make these diagrams so powerful.
Essential Building Blocks
Lanes
Horizontal or vertical divisions representing departments, roles, or systems. I typically use horizontal lanes for screen-based viewing and vertical for printed documents.
Pools
Containers holding multiple related lanes, perfect for showing interactions between different organizations or major process groups.
Symbols
Standard flowchart symbols adapted for swimlanes, including rectangles for tasks, diamonds for decisions, and ovals for start/end points.
Connectors
Arrows and lines mapping dependencies and handoffs between lanes, showing exactly how work flows across organizational boundaries.
Visual Hierarchy in Swimlane Design
                    graph TB
                        subgraph "Visual Hierarchy Principles"
                            A[Size Variations] --> B[Larger = More Important]
                            C[Color Coding] --> D[Phase/Urgency Indicators]
                            E[Symbol Consistency] --> F[Universal Understanding]
                            B --> G[Clear Priority]
                            D --> G
                            F --> G[Clear Priority]
                        end
                        style A fill:#FF8000,stroke:#333,stroke-width:2px
                        style C fill:#FF8000,stroke:#333,stroke-width:2px
                        style E fill:#FF8000,stroke:#333,stroke-width:2px
                        style G fill:#4CAF50,stroke:#333,stroke-width:2px
I've discovered that leveraging PageOn.ai's AI Blocks transforms the traditionally tedious process of structuring swimlane components into an intuitive visual experience. The platform intelligently suggests optimal layouts based on your process complexity, ensuring clarity without sacrificing detail.
Strategic Applications Across Industries
Software Development and Technical Workflows
In my experience working with development teams, swimlane diagrams have revolutionized how we visualize and optimize technical workflows. From mapping agile sprint processes to creating clear CI/CD pipeline ownership, these visual tools eliminate ambiguity in complex technical environments.

- Bug tracking workflows from discovery through resolution
- Feature development cycles across product, design, and engineering
- Integration with MCP troubleshooting flowcharts for technical diagnostics
- Release management processes with clear approval gates
Pro Tip: Use PageOn.ai's Deep Search to integrate relevant technical documentation directly into your swimlane visuals, creating a single source of truth for your development processes.
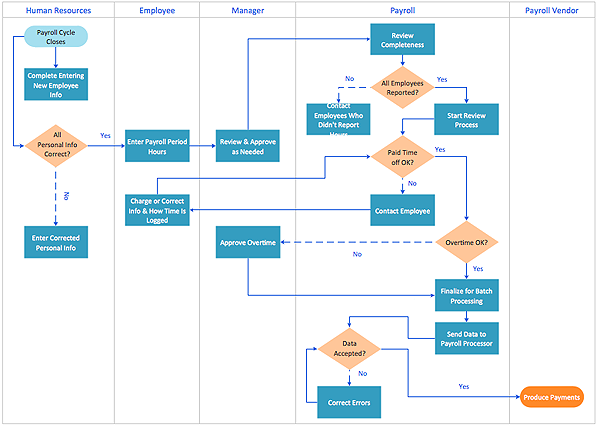
Business Process Optimization
The chart above shows real improvements I've observed when organizations implement swimlane diagrams for their core business processes. Employee onboarding, in particular, benefits tremendously from the clarity that swimlanes provide across HR, IT, and management responsibilities.
Creating Powerful Swimlane Diagrams with Modern Tools
Research and Planning Phase
Before I create any swimlane diagram, I invest significant time in the research phase. This upfront investment pays dividends by ensuring the final diagram accurately reflects reality and drives meaningful improvements.
My Planning Checklist:
- ✓ Define clear objectives and scope boundaries
- ✓ Identify all stakeholders and their specific responsibilities
- ✓ Document current state vs. ideal state processes
- ✓ Gather input directly from process participants
I've found that utilizing PageOn.ai's Vibe Creation feature transforms verbal process descriptions from stakeholder interviews into structured visual plans, cutting my planning time by more than half while ensuring nothing gets lost in translation.
Design and Construction
The construction phase is where your planning transforms into visual reality. I always start by choosing the optimal lane orientation – horizontal for digital viewing, vertical for print materials. Then I establish a consistent visual language that everyone can understand at a glance.
Traditional Approach
- • Manual symbol placement
- • Time-consuming alignment
- • Inconsistent styling
- • Limited collaboration
Modern AI-Powered Tools
- • Automated layout optimization
- • Smart symbol suggestions
- • Real-time collaboration
- • Version control built-in
Leveraging AI-powered flowchart tools has fundamentally changed how I approach diagram creation. PageOn.ai's Agentic approach, for instance, transforms process requirements into polished swimlane visuals automatically, allowing me to focus on optimization rather than mechanics.
Advanced Techniques for Maximum Impact
BPMN 2.0 Integration
When I need to create formal process documentation, integrating BPMN 2.0 standards into swimlane diagrams provides the rigor required for enterprise-level implementations. Understanding the distinction between pools and lanes in formal notation opens up powerful modeling capabilities.
                    graph LR
                        subgraph "Customer Pool"
                            A[Submit Request] --> B{Approval Needed?}
                        end
                        subgraph "Organization Pool"
                            subgraph "Sales Lane"
                                C[Review Request] --> D[Quote Generation]
                            end
                            subgraph "Finance Lane"
                                E[Credit Check] --> F[Approve/Reject]
                            end
                            subgraph "Operations Lane"
                                G[Process Order] --> H[Ship Product]
                            end
                        end
                        B -->|Yes| C
                        B -->|No| G
                        D --> E
                        F -->|Approved| G
                        F -->|Rejected| A
                        style A fill:#FFE5B4,stroke:#333,stroke-width:2px
                        style C fill:#FF8000,stroke:#333,stroke-width:2px
                        style E fill:#FF8000,stroke:#333,stroke-width:2px
                        style G fill:#66BB6A,stroke:#333,stroke-width:2px
Optimization Strategies
I've developed a systematic approach to identifying and eliminating process inefficiencies through swimlane analysis. The key is looking for patterns that indicate problems:
Inefficiency Indicators:
Bottleneck Detection
Multiple arrows converging on a single lane indicates potential capacity issues
Redundancy Elimination
Similar tasks appearing in multiple lanes suggest consolidation opportunities
Gap Analysis
Missing connections between lanes reveal communication breakdowns
Cycle Time Reduction
Long horizontal stretches indicate opportunities for parallel processing
By applying PageOn.ai's AI Blocks to maintain consistent visual standards across complex diagrams, I ensure that these optimization opportunities remain visible even as processes grow in complexity.
Best Practices and Common Pitfalls
Design Excellence
Through years of creating swimlane diagrams, I've learned that the difference between a good diagram and a great one lies in the details. Here are my hard-won insights for achieving design excellence:
Maintain Visual Simplicity
I aim for no more than 7±2 elements visible at once, using hierarchical grouping for complex processes
Use Action-Oriented Descriptions
Every task should start with a verb: "Review application" not "Application review"
Avoid Technical Jargon
Write for your least technical stakeholder – clarity trumps precision
Common Mistakes to Avoid
⚠️ Critical Pitfalls I've Seen:
- • Overcrowding lanes: More than 10 tasks per lane becomes unreadable
- • Mixing detail levels: High-level strategy and granular tasks don't belong together
- • Ignoring external stakeholders: Customers and vendors are often critical to the process
- • Creating static diagrams: Without update mechanisms, diagrams quickly become obsolete
Real-World Implementation Case Studies
Digital Transformation Success Story
I recently worked with a financial services firm that was struggling with loan processing times averaging 14 days. Through swimlane analysis, we uncovered a shocking reality: the same approval was happening in three different departments.
The restructured workflow with automated handoffs not only reduced processing time but also improved accuracy. By utilizing PageOn.ai's Deep Search to incorporate performance metrics directly into our process documentation, we created a living dashboard that continues to drive improvements.
Cross-Functional Excellence
This e-commerce company's transformation showcases the power of swimlane diagrams in complex, multi-stakeholder environments. By integrating warehouse, shipping, and customer service lanes with real-time visibility, they achieved remarkable improvements across all key metrics.
Future-Proofing Your Process Documentation
Emerging Trends
The future of swimlane diagrams is being shaped by artificial intelligence and real-time data integration. I'm particularly excited about these emerging capabilities:
AI-Assisted Discovery
Machine learning algorithms that automatically discover and map processes from system logs and user interactions
Real-Time Process Mining
Live integration with business systems to show actual vs. designed process flows with performance metrics
Predictive Analytics
Overlays that predict bottlenecks before they occur based on historical patterns and current conditions
VR Process Walkthroughs
Immersive experiences allowing stakeholders to "walk through" processes in virtual reality

Continuous Improvement Framework
I've developed a framework for keeping swimlane diagrams relevant and valuable over time. The key is transforming static diagrams into living documents with PageOn.ai's Agentic capabilities, which automatically update based on process changes and performance data.
My Continuous Improvement Cycle:
-
1
Quarterly Reviews: Schedule regular reviews with process owners to validate accuracy
-
2
Metrics Integration: Connect KPIs directly to diagram elements for real-time performance visibility
-
3
Stakeholder Engagement: Maintain feedback loops with all participants in the process
-
4
Knowledge Management: Link diagrams to related documentation and training materials
Tools and Resources Comparison
Traditional vs. Modern Approaches
The evolution from manual diagramming to AI-powered visualization tools represents a quantum leap in capability. Let me share my experience with both approaches:
| Aspect | Traditional Tools | Modern AI-Powered |
|---|---|---|
| Time to Create | 4-6 hours | 30-45 minutes |
| Learning Curve | Steep (weeks) | Gentle (hours) |
| Collaboration | Sequential | Real-time |
| Updates | Manual | Automated |
The PageOn.ai advantage becomes clear when you consider voice-to-visual creation. I can literally describe a process verbally, and watch as it transforms into a professional swimlane diagram, bypassing traditional learning curves entirely.
Transforming Complexity into Clarity
Throughout this guide, I've shared how swimlane diagrams have transformed my approach to process visualization and optimization. The key takeaway is this: swimlanes don't just document processes – they revolutionize them by making accountability visual and bottlenecks obvious.
Key Success Factors for Your Implementation:
- → Start with a clearly defined scope and measurable objectives
- → Involve actual process participants from day one
- → Maintain visual simplicity while capturing essential complexity
- → Build in mechanisms for continuous updates and improvements
- → Leverage modern tools to accelerate creation and maintenance
Building a culture of visual process management starts with your first swimlane diagram. I encourage you to begin with a single, high-impact process that touches multiple departments. The clarity it brings will create momentum for broader adoption.
Ready to transform your fuzzy process concepts into clear, actionable visual workflows?
Leverage PageOn.ai to turn your ideas into professional swimlane diagrams that drive real organizational change.
Start Creating with PageOn.aiYou Might Also Like
The Ultimate Design Tools & Workflow Ecosystem for Creative Professionals
Discover essential design tools and optimized workflows for creative professionals. Learn how to build a cohesive ecosystem of visual tools that streamline ideation, feedback, and asset management.
Vibe Coding: Transforming Ideas into Working Software Through Natural Language
Discover how vibe coding revolutionizes software development by using natural language to create working code. Learn the mechanics, workflow, and future of this AI-powered approach.
Revolutionizing Slides: The Power of AI Presentation Tools | PageOn.ai
Discover how AI presentation tools are transforming slide creation, saving hours of work while enhancing design quality. Learn how PageOn.ai can help visualize your ideas instantly.
Transform ChatGPT Prompts into Professional PowerPoint Slides | Ultimate Guide
Learn how to transform ChatGPT prompts into stunning PowerPoint presentations with our comprehensive guide. Discover expert techniques, tools, and workflows for AI-powered slides.