Mastering Complex Systems: How Top Flowchart Software Transforms Business Process Visualization
Discover the Power of Visual Process Mapping in 2025
In my journey through countless business transformation projects, I've witnessed firsthand how the right flowchart software can turn organizational chaos into streamlined clarity. Let me guide you through the landscape of today's most powerful visualization tools.
The Power of Visual Process Mapping
In my two decades of helping organizations transform their operations, I've learned one fundamental truth: complex systems become manageable when we can see them clearly. The evolution from simple hand-drawn diagrams to today's sophisticated process visualization platforms represents more than technological advancement—it's a revolution in how we understand and optimize business operations.
The landscape of flowchart software has undergone a dramatic transformation, particularly with the emergence of AI-powered flowchart tools that can interpret natural language and generate complex diagrams in seconds. This convergence of traditional diagramming with artificial intelligence opens unprecedented possibilities for turning abstract concepts into concrete visual representations.
What excites me most about platforms like PageOn.ai is their philosophy of "Turn Fuzzy Thought into Clear Visuals"—a principle that perfectly aligns with the enterprise need for rapid ideation and clear communication. As we explore the top flowchart software available today, I'll show you how each tool addresses specific organizational challenges and where innovative features like PageOn.ai's AI Blocks could enhance traditional approaches.
Enterprise Leaders: Comprehensive Solutions for Complex Organizations
Lucidchart: The Industry Standard
When I work with Fortune 500 companies, Lucidchart consistently emerges as their preferred platform. Its real-time collaboration features have transformed how distributed teams approach process documentation. I've watched teams in Tokyo, London, and New York simultaneously refine complex workflows, each contribution appearing instantly across all screens.
What sets Lucidchart apart is its sophisticated data linking capability. I recently helped a logistics company connect their inventory spreadsheets directly to process flowcharts, creating dynamic visualizations that update automatically as data changes. This transforms static diagrams into living documents that reflect real-time operational status.
The platform's cross-platform compatibility addresses a critical need in today's hybrid work environment. However, I see tremendous potential for enhancement through PageOn.ai's AI Blocks approach, which could add modular intelligence to Lucidchart's template-based system, enabling users to build self-optimizing process flows.
Microsoft Visio: The Windows Ecosystem Champion
Visio's deep integration with the Microsoft 365 suite makes it indispensable for organizations already invested in the Microsoft ecosystem. I've seen IT departments leverage this integration to pull data directly from SharePoint lists, Excel spreadsheets, and SQL databases, creating flowcharts that serve as operational dashboards.
Particularly impressive are Visio's accessibility features—screen reader compatibility and high-contrast modes ensure inclusive team collaboration. However, the platform's Windows-centric approach creates challenges for diverse device environments, highlighting opportunities for more platform-agnostic solutions.
Enterprise Platform Comparison
Innovation Through AI: Next-Generation Flowchart Creation

The integration of artificial intelligence into flowchart software represents a paradigm shift I've been eagerly tracking. Tools like Whimsical and EdrawMax aren't just adding AI as a gimmick—they're fundamentally reimagining how we translate ideas into visual structures.
I recently experimented with Whimsical's AI-assisted generation, asking it to "create a flowchart for customer onboarding in a SaaS platform." Within seconds, it produced a surprisingly comprehensive starting point that captured industry best practices. While not perfect, it saved hours of initial structuring work.
EdrawMax takes a different approach with its comprehensive AI productivity suite. Beyond flowchart generation, it offers document summarization, image editing, and report generation—all within the same platform. This aligns beautifully with PageOn.ai's "Vibe Creation" concept, where the tool understands context and mood to generate appropriate visualizations.
AI-Powered Flowchart Generation Process
                    flowchart TD
                        A[Natural Language Input] --> B{AI Processing}
                        B --> C[Context Analysis]
                        B --> D[Pattern Recognition]
                        B --> E[Best Practice Database]
                        C --> F[Initial Diagram Generation]
                        D --> F
                        E --> F
                        F --> G[User Refinement]
                        G --> H[Final Flowchart]
                        style A fill:#FF8000
                        style H fill:#66BB6A
What excites me most is the potential for combining AI generation with manual refinement. Imagine leveraging PageOn.ai's Deep Search capability to automatically suggest relevant assets and data sources while building flowcharts—this could transform how we integrate organizational knowledge into process documentation.
Collaborative Platforms: Beyond Individual Diagramming
Miro: The All-in-One Remote Workspace
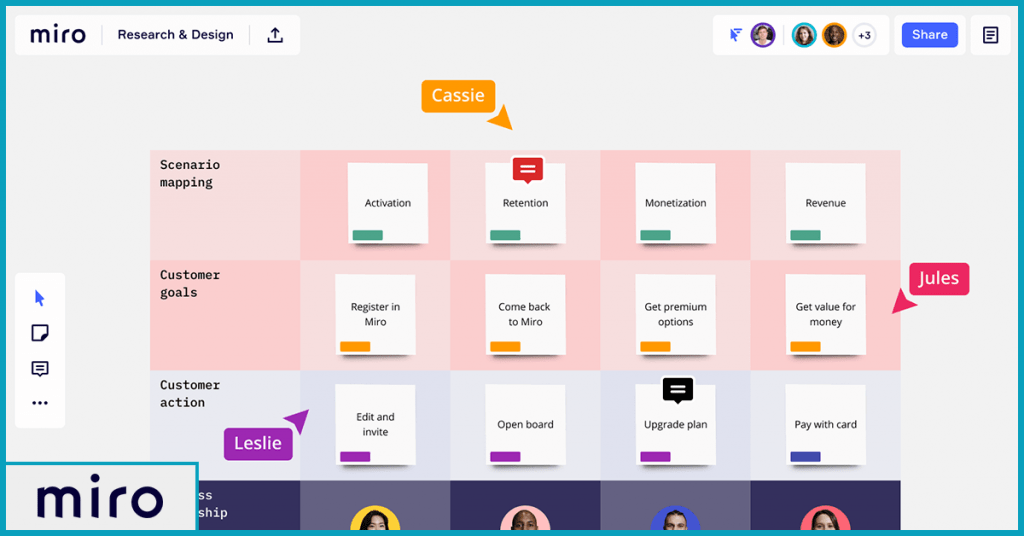
Miro has revolutionized how I facilitate remote workshops. Its infinite canvas approach means we're never constrained by space when mapping complex, interconnected processes. I've run sessions where teams discovered process dependencies they'd never noticed before, simply because Miro allowed them to see everything at once.
The platform brilliantly integrates flowcharting with broader project management needs. Teams can move seamlessly from brainstorming with sticky notes to creating formal process diagrams, all within the same workspace. This continuity eliminates the friction of switching between tools.
Specialized Collaboration Tools
Cacoo's laser focus on Atlassian integration makes it invaluable for teams already using Jira and Confluence. I've helped development teams embed live flowcharts directly into their sprint documentation, creating a single source of truth for process understanding.
Creately's AI-powered suggestions represent an interesting middle ground—not full automation, but intelligent assistance. As users build flowcharts, it suggests next logical steps based on patterns from millions of diagrams. This is where I see PageOn.ai's Agentic approach potentially transforming the landscape, imagine flowchart software that not only suggests but actively optimizes processes based on organizational goals.
Accessible Solutions: Free and Budget-Friendly Options
Draw.io (diagrams.net): The Open-Source Champion
I have immense respect for Draw.io's commitment to remaining completely free without hidden limitations. For startups and educational institutions I advise, it's often my first recommendation. The desktop version's offline capability addresses security concerns for organizations handling sensitive process documentation.
What impresses me most is the community-driven development model. Users contribute templates, shapes, and even entire libraries specific to their industries. This organic growth has created a remarkably comprehensive tool that rivals paid alternatives in functionality.
Budget-Conscious Professional Tools
SmartDraw's automatic formatting feature is a game-changer for non-designers. I've watched executives create professional-looking flowcharts in minutes, with the software automatically aligning elements and maintaining consistent spacing. This democratization of design aligns perfectly with modern business needs.
Gliffy offers a lightweight approach that works well for occasional users. Its simplicity is its strength—teams can create flowchart examples without extensive training, making it ideal for organizations where process mapping isn't a daily activity.
| Tool | Free Tier | Paid Starting Price | Best For |
|---|---|---|---|
| Draw.io | Unlimited | Free | Open-source enthusiasts |
| SmartDraw | 7-day trial | $9.95/month | Auto-formatting needs |
| Gliffy | Limited | $8/month | Occasional users |
Specialized Applications: Industry-Specific Solutions
Technical Diagramming Excellence
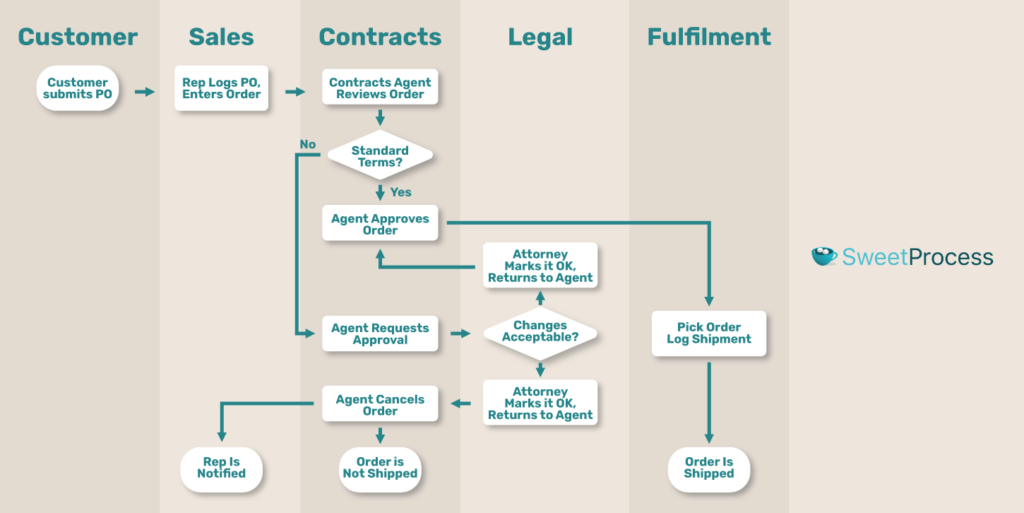
For organizations requiring strict BPMN compliance, the landscape varies significantly. I've worked with financial institutions where precise notation isn't optional—it's regulatory. Tools supporting comprehensive flowchart symbols libraries become essential in these contexts.
Engineering teams have unique requirements that general-purpose tools often miss. The ability to create UML diagrams, network topologies, and system architectures within the same platform streamlines technical documentation. I've seen organizations save weeks of documentation time by choosing specialized tools over generic alternatives.
Creative and Design-Focused Tools
Canva's approach to flowcharting fascinates me—it prioritizes aesthetics without sacrificing functionality. Marketing teams I work with love how they can create process diagrams that match their brand guidelines perfectly. This visual consistency across all materials strengthens organizational identity.
Figma and FigJam have revolutionized UX/UI workflow visualization. Designers can map user journeys and immediately translate them into interface mockups. Moqups takes this further with interactive prototypes, allowing teams to test process flows before implementation.
Platform Considerations: Choosing the Right Environment
Cloud-Based vs. Desktop Solutions
The cloud versus desktop debate isn't just about convenience—it's about fundamental workflow philosophy. Cloud-based solutions offer unparalleled accessibility; I can review and edit flowcharts from my phone during a commute or quickly share diagrams in video calls without screen sharing.
However, desktop solutions still have their place. Government contractors and healthcare organizations I consult for often require air-gapped environments for sensitive process documentation. Tools like OmniGraffle for Mac provide professional capabilities without cloud dependencies.
Platform Selection Decision Tree
                    flowchart TD
                        A[Platform Choice] --> B{Team Size?}
                        B -->|Small Team| C{Budget?}
                        B -->|Large Team| D{Security Requirements?}
                        C -->|Limited| E[Free/Open Source]
                        C -->|Flexible| F[Professional Cloud]
                        D -->|High| G[On-Premise/Desktop]
                        D -->|Standard| H[Enterprise Cloud]
                        E --> I[Draw.io]
                        F --> J[Lucidchart/Miro]
                        G --> K[Visio/OmniGraffle]
                        H --> L[Enterprise Lucidchart]
                        style A fill:#FF8000
                        style I fill:#66BB6A
                        style J fill:#66BB6A
                        style K fill:#66BB6A
                        style L fill:#66BB6A
Cross-Platform Compatibility
In today's diverse device ecosystem, cross-platform compatibility isn't optional. I've seen projects stall because key stakeholders couldn't access flowcharts on their preferred devices. Web-based tools eliminate these barriers, ensuring universal access regardless of operating system.
Mobile functionality varies dramatically across platforms. While most offer viewing capabilities, editing complex flowcharts on mobile remains challenging. This is where innovative approaches like PageOn.ai's responsive design philosophy could revolutionize mobile diagramming.
Advanced Features: Beyond Basic Flowcharting
Data Integration and Automation

The ability to link flowcharts to live data sources transforms static diagrams into dynamic operational dashboards. I recently helped a manufacturing client connect their ERP system to process flowcharts, creating real-time visibility into production bottlenecks. When machine downtime occurred, the affected process steps turned red automatically.
Integration with data visualization software amplifies the power of flowcharts exponentially. By combining process flows with performance metrics, organizations gain unprecedented insight into operational efficiency.
Process Optimization Features
Modern flowchart software increasingly includes simulation capabilities. I can model different scenarios, adjust variables, and predict outcomes before implementing process changes. This predictive capability saves organizations from costly trial-and-error approaches.
The integration potential with PageOn.ai's Agentic processes excites me tremendously. Imagine flowchart software that not only visualizes processes but actively suggests optimizations based on performance data, industry benchmarks, and AI-driven insights. This convergence of visualization and intelligence represents the future of process management.
Advanced Features Comparison
Future Trends: The Evolution of Flowchart Software
Emerging Technologies

The convergence of AI and process visualization is accelerating at an unprecedented pace. Natural language processing now enables users to describe complex processes conversationally, with AI translating these descriptions into structured flowcharts. I recently tested a prototype that understood context so well it could infer missing process steps based on industry best practices.
Virtual reality interfaces for 3D process visualization aren't science fiction anymore. I've experienced walking through process flows in VR, where complex interdependencies become intuitively understandable through spatial representation. This immersive approach revolutionizes how we comprehend multi-layered organizational processes.
How PageOn.ai's Features Could Shape the Future
PageOn.ai's "Vibe Creation" concept could transform how we approach flowchart aesthetics. Imagine describing the mood you want—"professional yet approachable" or "innovative and dynamic"—and having the software automatically adjust colors, shapes, and layouts to match. This emotional intelligence in design tools represents a paradigm shift from functional to experiential visualization.
The Deep Search capability could revolutionize asset discovery during flowchart creation. As I build a customer service process flow, the system could automatically suggest relevant data visualization graph tools, templates from similar industries, and even regulatory compliance checkpoints I might have overlooked.
AI Blocks represent modular intelligence—imagine flowchart components that self-optimize based on performance metrics. A approval process block could automatically adjust routing rules based on historical completion times and bottleneck analysis. The Agentic approach takes this further, with flowcharts that actively monitor their represented processes and suggest improvements in real-time.
Making the Right Choice: Selection Criteria
Evaluating Your Organization's Needs
Choosing the right flowchart software requires honest assessment of your organization's maturity and ambitions. I guide clients through a structured evaluation process, starting with team size and collaboration patterns. A five-person startup has fundamentally different needs than a multinational corporation with distributed teams.
Technical complexity matters enormously. If you're documenting simple linear processes, almost any tool suffices. But if you're mapping intricate systems with multiple decision points, parallel processes, and exception handling, you need sophisticated capabilities. I've seen organizations outgrow their initial choices within months because they underestimated their complexity needs.
Key Features to Prioritize
Template libraries might seem trivial, but they're productivity multipliers. The right template can save hours of initial setup and ensure consistency across your organization. Integration capabilities determine whether your flowcharts become isolated artifacts or living components of your operational ecosystem.
Never underestimate the learning curve factor. I've witnessed expensive software implementations fail because teams found the tools too complex. The best flowchart software balances power with accessibility, enabling both novices and experts to be productive.
| Criteria | Small Teams | Medium Organizations | Large Enterprises |
|---|---|---|---|
| Budget Priority | High | Medium | Low |
| Collaboration Needs | Basic | Advanced | Enterprise-grade |
| Integration Requirements | Minimal | Moderate | Extensive |
| Security Concerns | Standard | Enhanced | Maximum |
Future-Proofing Your Investment
Scalability isn't just about user numbers—it's about growing sophistication. The flowchart software that serves you today should evolve with your organization's increasing process maturity. I always investigate vendor roadmaps and development velocity before recommending long-term commitments.
Data portability remains critically important yet often overlooked. Ensure your chosen platform allows export in standard formats. Vendor lock-in can become expensive when organizational needs evolve beyond a platform's capabilities.
Transform Your Visual Expressions with PageOn.ai
Ready to revolutionize how you transform complex ideas into clear, compelling visual stories? PageOn.ai combines the power of AI-driven visualization with intuitive design tools to help you create stunning flowcharts, diagrams, and visual expressions that truly resonate with your audience.
Start Creating with PageOn.ai TodayTransforming Complexity into Clarity
As we've explored the landscape of flowchart software, from enterprise giants to innovative AI-powered newcomers, one truth emerges clearly: the right visualization tool can transform organizational understanding and efficiency. Whether you choose Lucidchart's collaborative power, Miro's infinite canvas, or Draw.io's open-source flexibility, the key is matching capabilities to your specific needs.
The future of flowchart software isn't just about better drawing tools—it's about intelligent systems that understand context, suggest improvements, and actively help organizations optimize their processes. Platforms like PageOn.ai, with their focus on turning fuzzy thoughts into clear visuals through AI-powered features like Vibe Creation and Deep Search, represent this next evolution.
I encourage you to experiment with multiple platforms before committing. Take advantage of free trials, test collaboration features with your actual team, and stress-test integration capabilities with your existing tools. The perfect flowchart software for your organization is out there—and with the rapid pace of innovation, it's becoming more powerful and accessible every day.
Remember, the ultimate goal isn't creating beautiful diagrams—it's achieving clarity that drives action. When complex processes become visually clear, teams align, inefficiencies surface, and organizations transform. Choose the tool that best helps you achieve this clarity, and watch as visual thinking revolutionizes how your organization operates.
You Might Also Like
The Creative Edge: Harnessing Templates and Icons for Impactful Visual Design
Discover how to leverage the power of templates and icons in design to boost creativity, not restrict it. Learn best practices for iconic communication and template customization.
Transforming Raw Data into Compelling Business Stories | Data Storytelling Guide
Learn how to transform raw data into powerful business narratives through effective data storytelling techniques. Discover visualization methods and narrative structures that drive decision-making.
Print vs Digital Design: Navigating Today's Hybrid Market Landscape
Explore the evolving relationship between print and digital design disciplines, with insights on market trends, strategic applications, and essential skills for cross-disciplinary designers.
Mastering Content Rewriting: How Gemini's Smart Editing Transforms Your Workflow
Discover how to streamline content rewriting with Gemini's smart editing capabilities. Learn effective prompts, advanced techniques, and workflow optimization for maximum impact.