
Designer-Quality
Slides, Posters
& Infographics Made by AI
One prompt. Typography, layout, color, hierarchy, and data visualization — every design element, generated in sync. Not another template filler.

Tired of AI tools that still output plain bullet-point slides?
We gave the same “AI Trends 2026” brief to a typical AI presentation tool — and to PageOn.
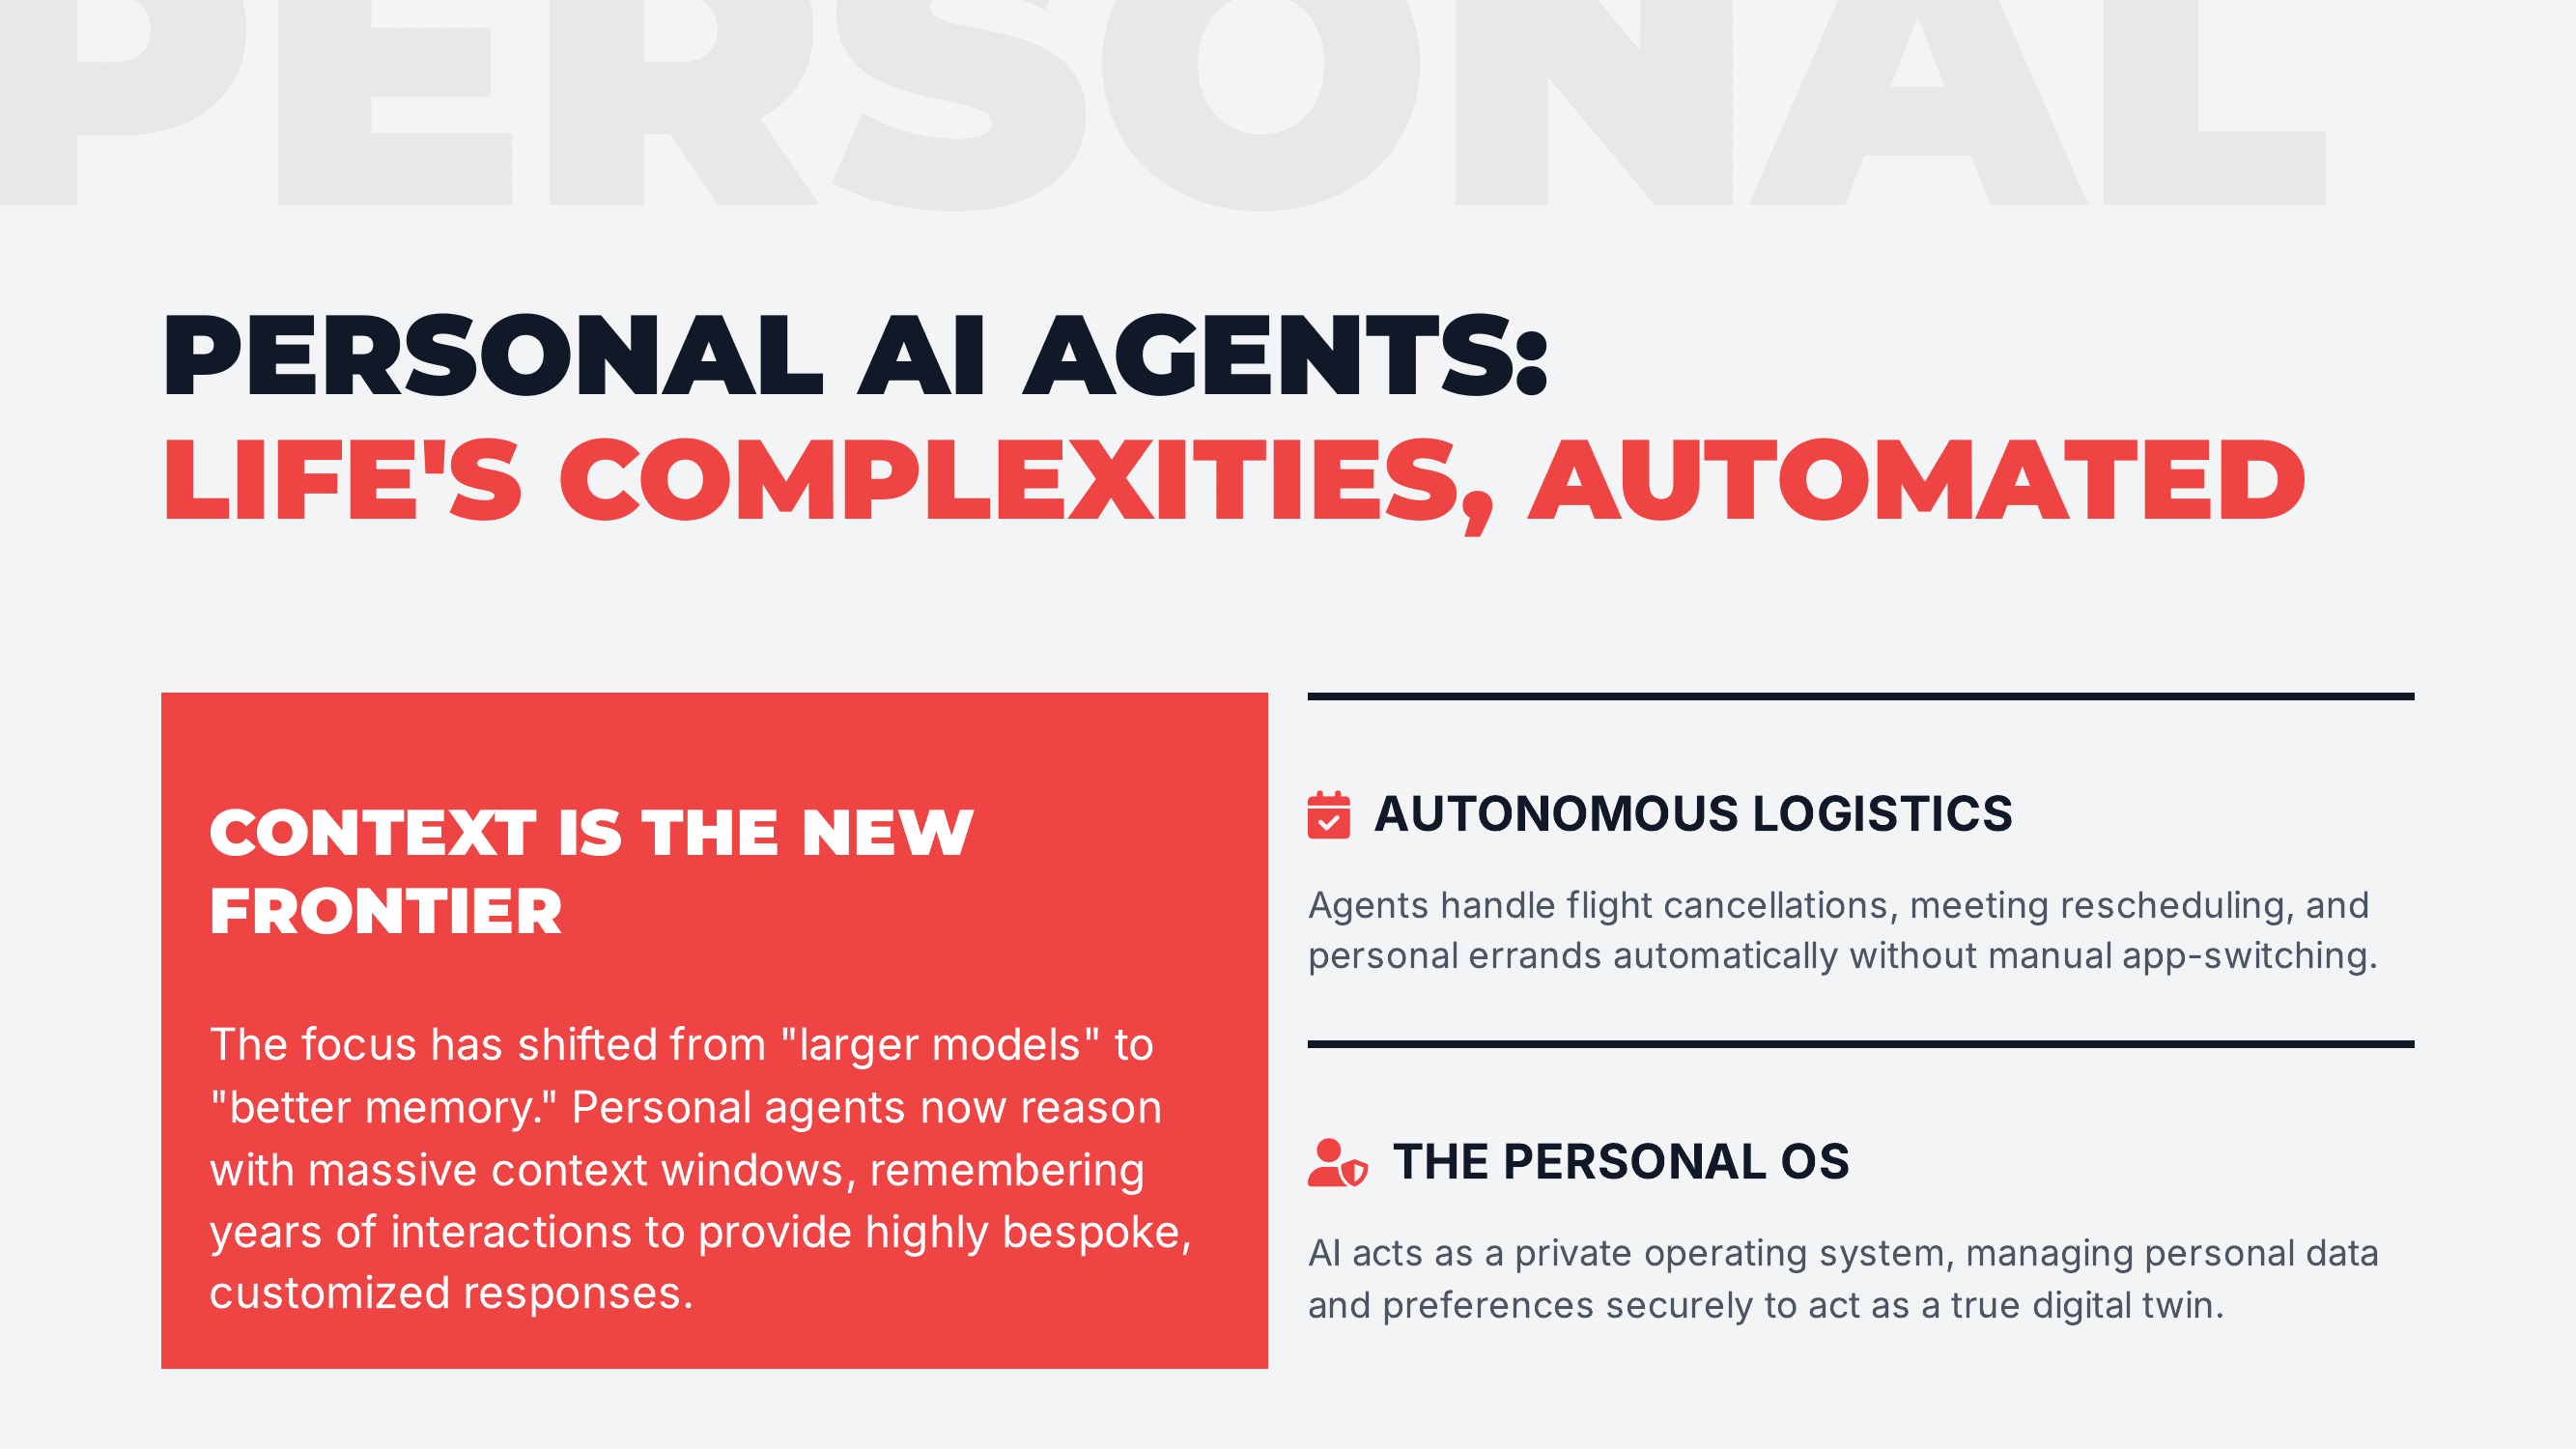
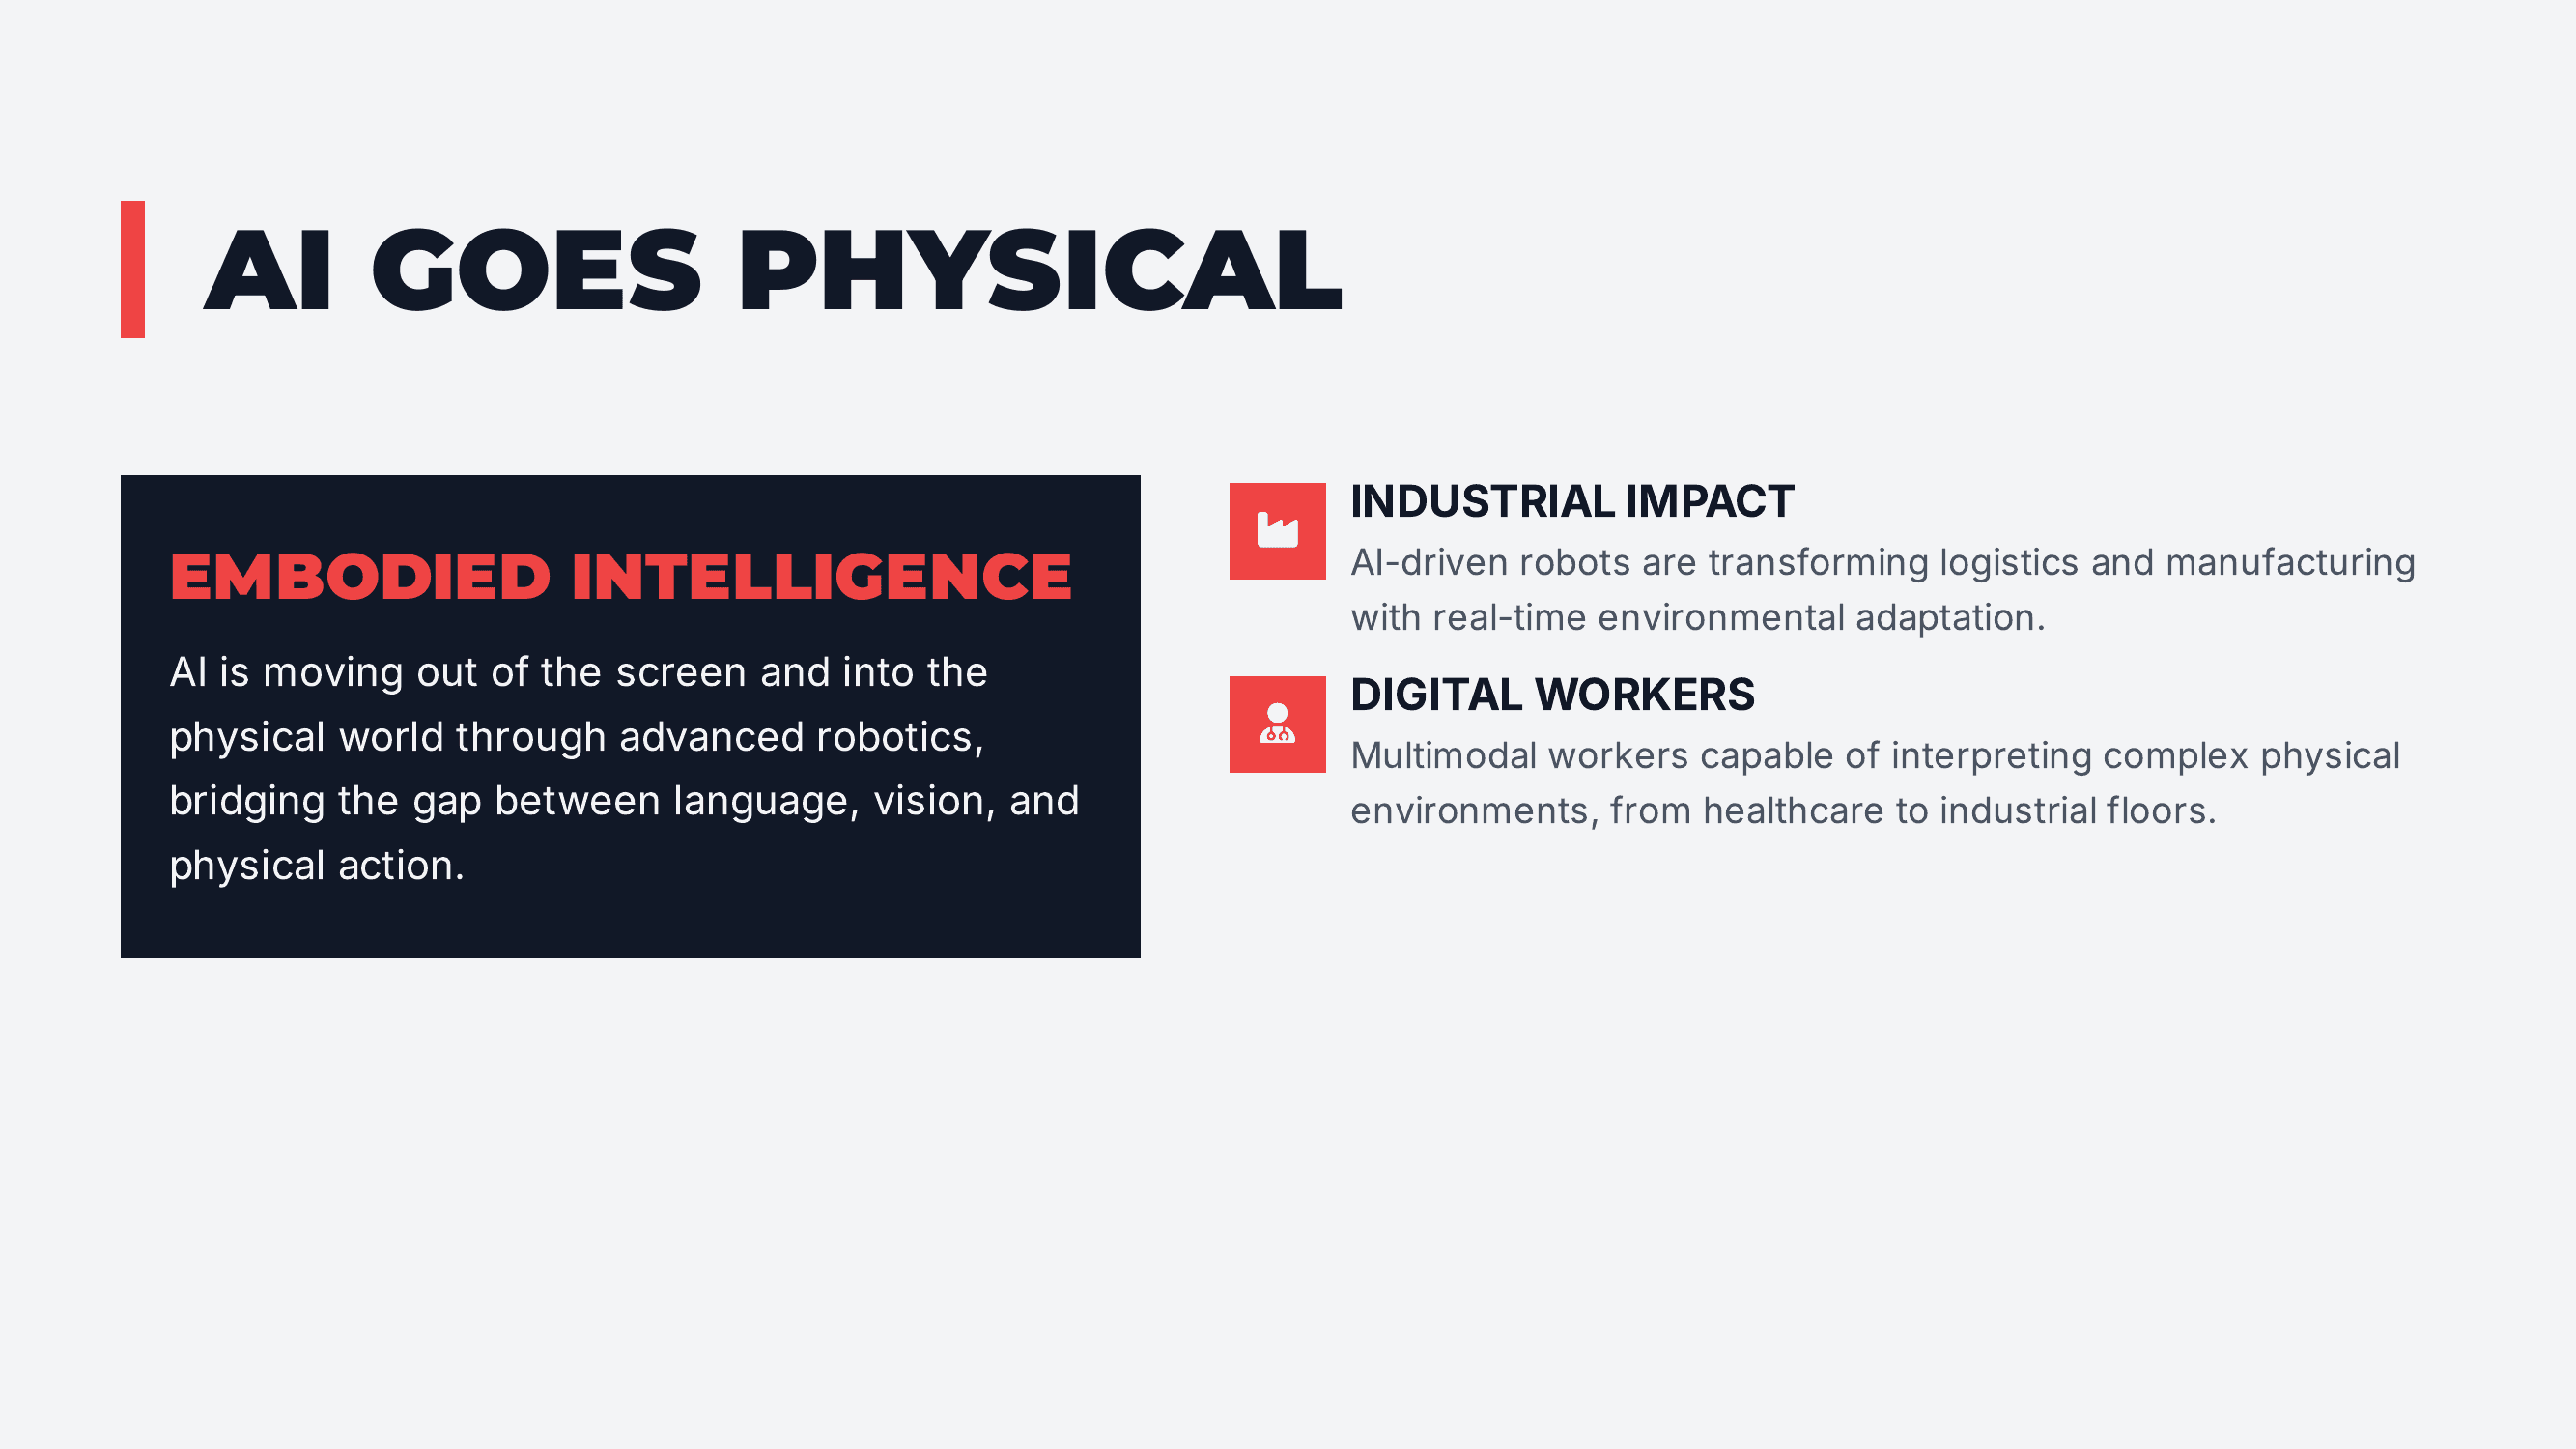
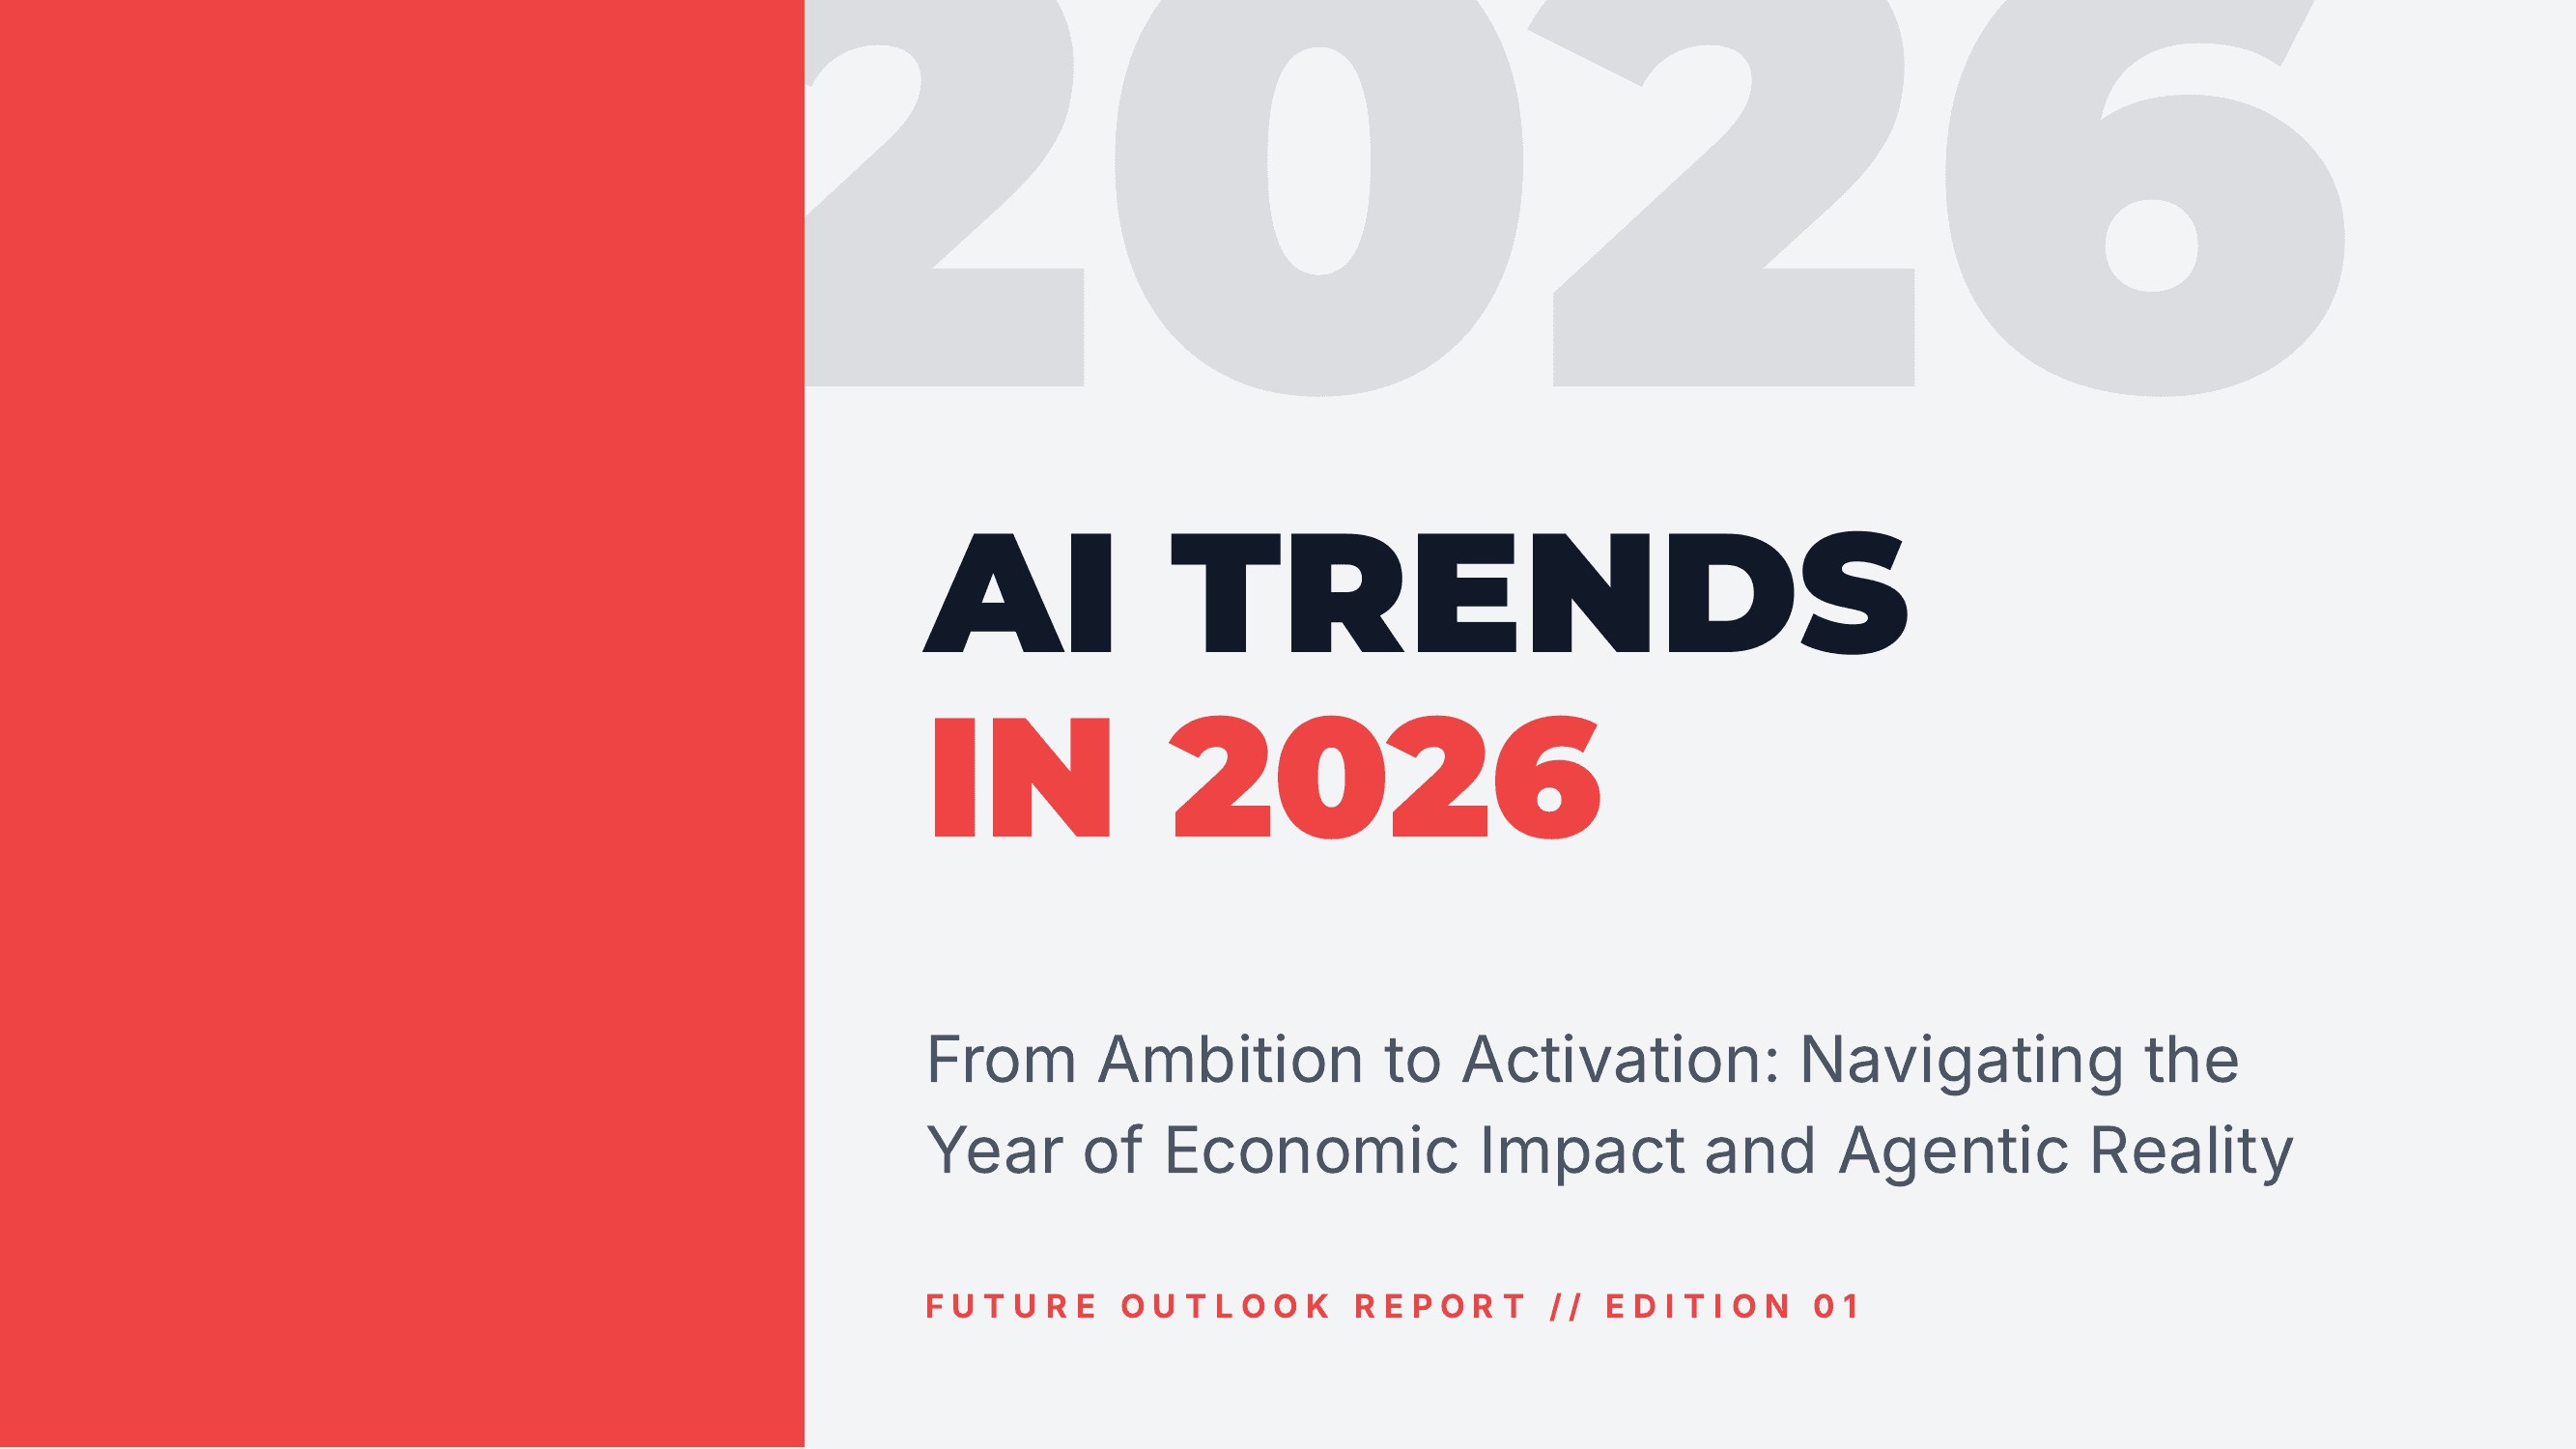
Red accents, bullet points, and the same “Future Outlook Report” template — interchangeable across tools.
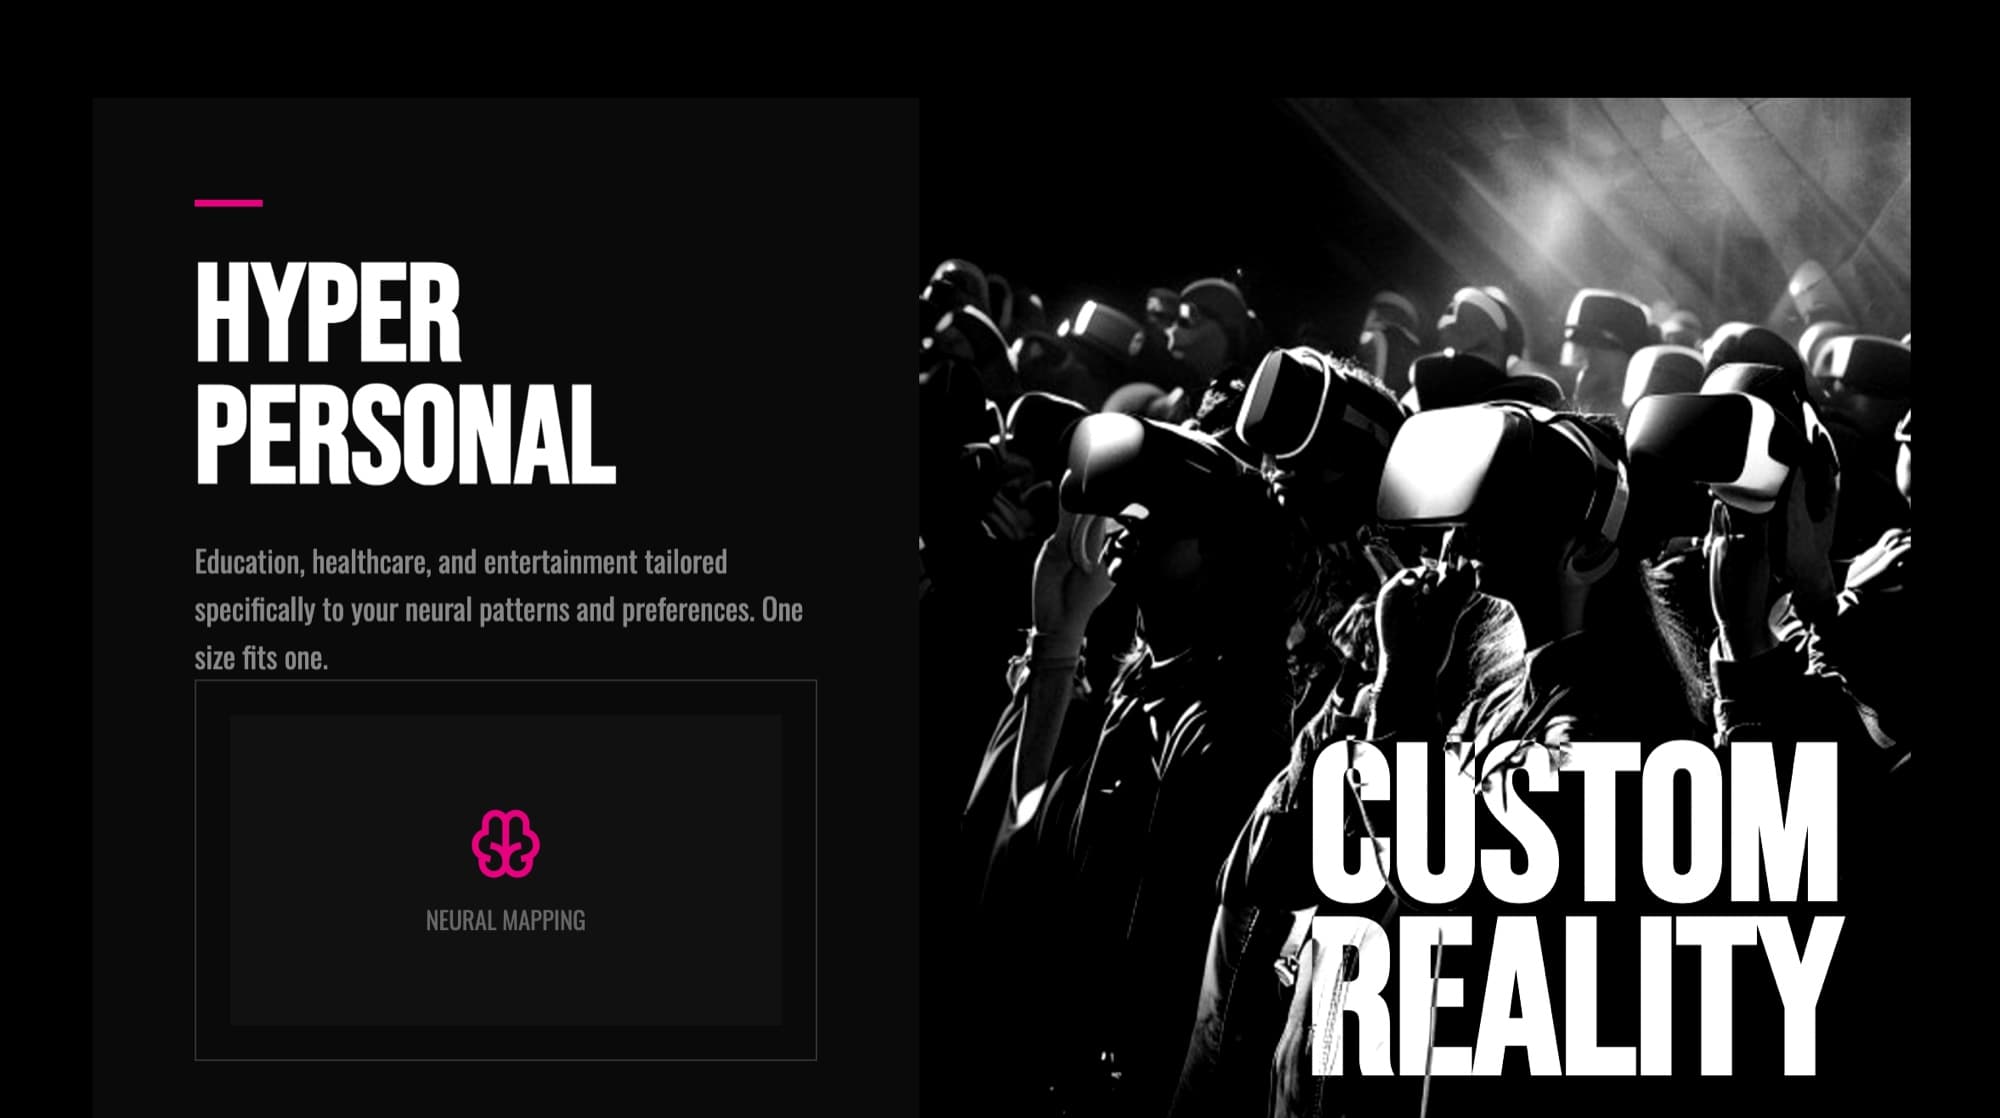

Same “AI Trends 2026” deck, three distinct designs — editorial photography, cinematic typography, and atmospheric storytelling. Every slide carries a different visual voice.
Every other tool returned the same slide pack. PageOn designed a narrative — different layouts, different tone, different voice. That’s what a visual agent does.
Most AI slide tools still think “presentation” means bullet points on a plain background. PageOn was built for the opposite: turn a topic, a dataset, or a document into a fully designed visual — with charts, infographic blocks, and layouts that adapt to your audience. Used by 100,000+ creators across 120 countries who need their work to look presented, not pasted.
PageOn in one sentence: An AI agent that generates designer-quality presentations — custom layouts, real data visualizations, and editorial typography — from a single prompt. Not a template filler.
From idea to visual presentation in four steps
- 01
Describe your topic or import a file
Type what you want to present, paste a URL, upload a PDF, or import CSV data. The AI understands your goal, audience, and tone.
- 02
AI researches and plans the visual structure
PageOn’s Agent researches your topic, gathers supporting data, and plans a narrative that matches your use case.
- 03
AI designs every slide with custom visuals
Each slide gets its own layout — charts, diagrams, infographic blocks, and iconography — rather than a recycled template.
- 04
Edit with point-and-chat, then share
Select any element and chat with the Agent to refine it. Share as an interactive web link on any plan, or export to PDF, PowerPoint, and images with Pro.
Start from any input
PageOn accepts the formats you already work with — no reformatting required.
| Input | PageOn processes it as |
|---|---|
| CSV / Excel | Chart-ready data — auto-detects columns and data types |
| Text extraction + visual summary slides with charts where relevant | |
| DOC / DOCX | Text extraction and structured outline for the deck |
| Markdown | Structured outline with headings, lists, and code blocks preserved |
| URL | Crawled content with cited references included on the slides |
| Plain text / prompt | Topic outline researched and expanded into a full deck |
| Images | Integrated as slide visuals or used as references for generated layouts |
Everything you need for a truly visual presentation
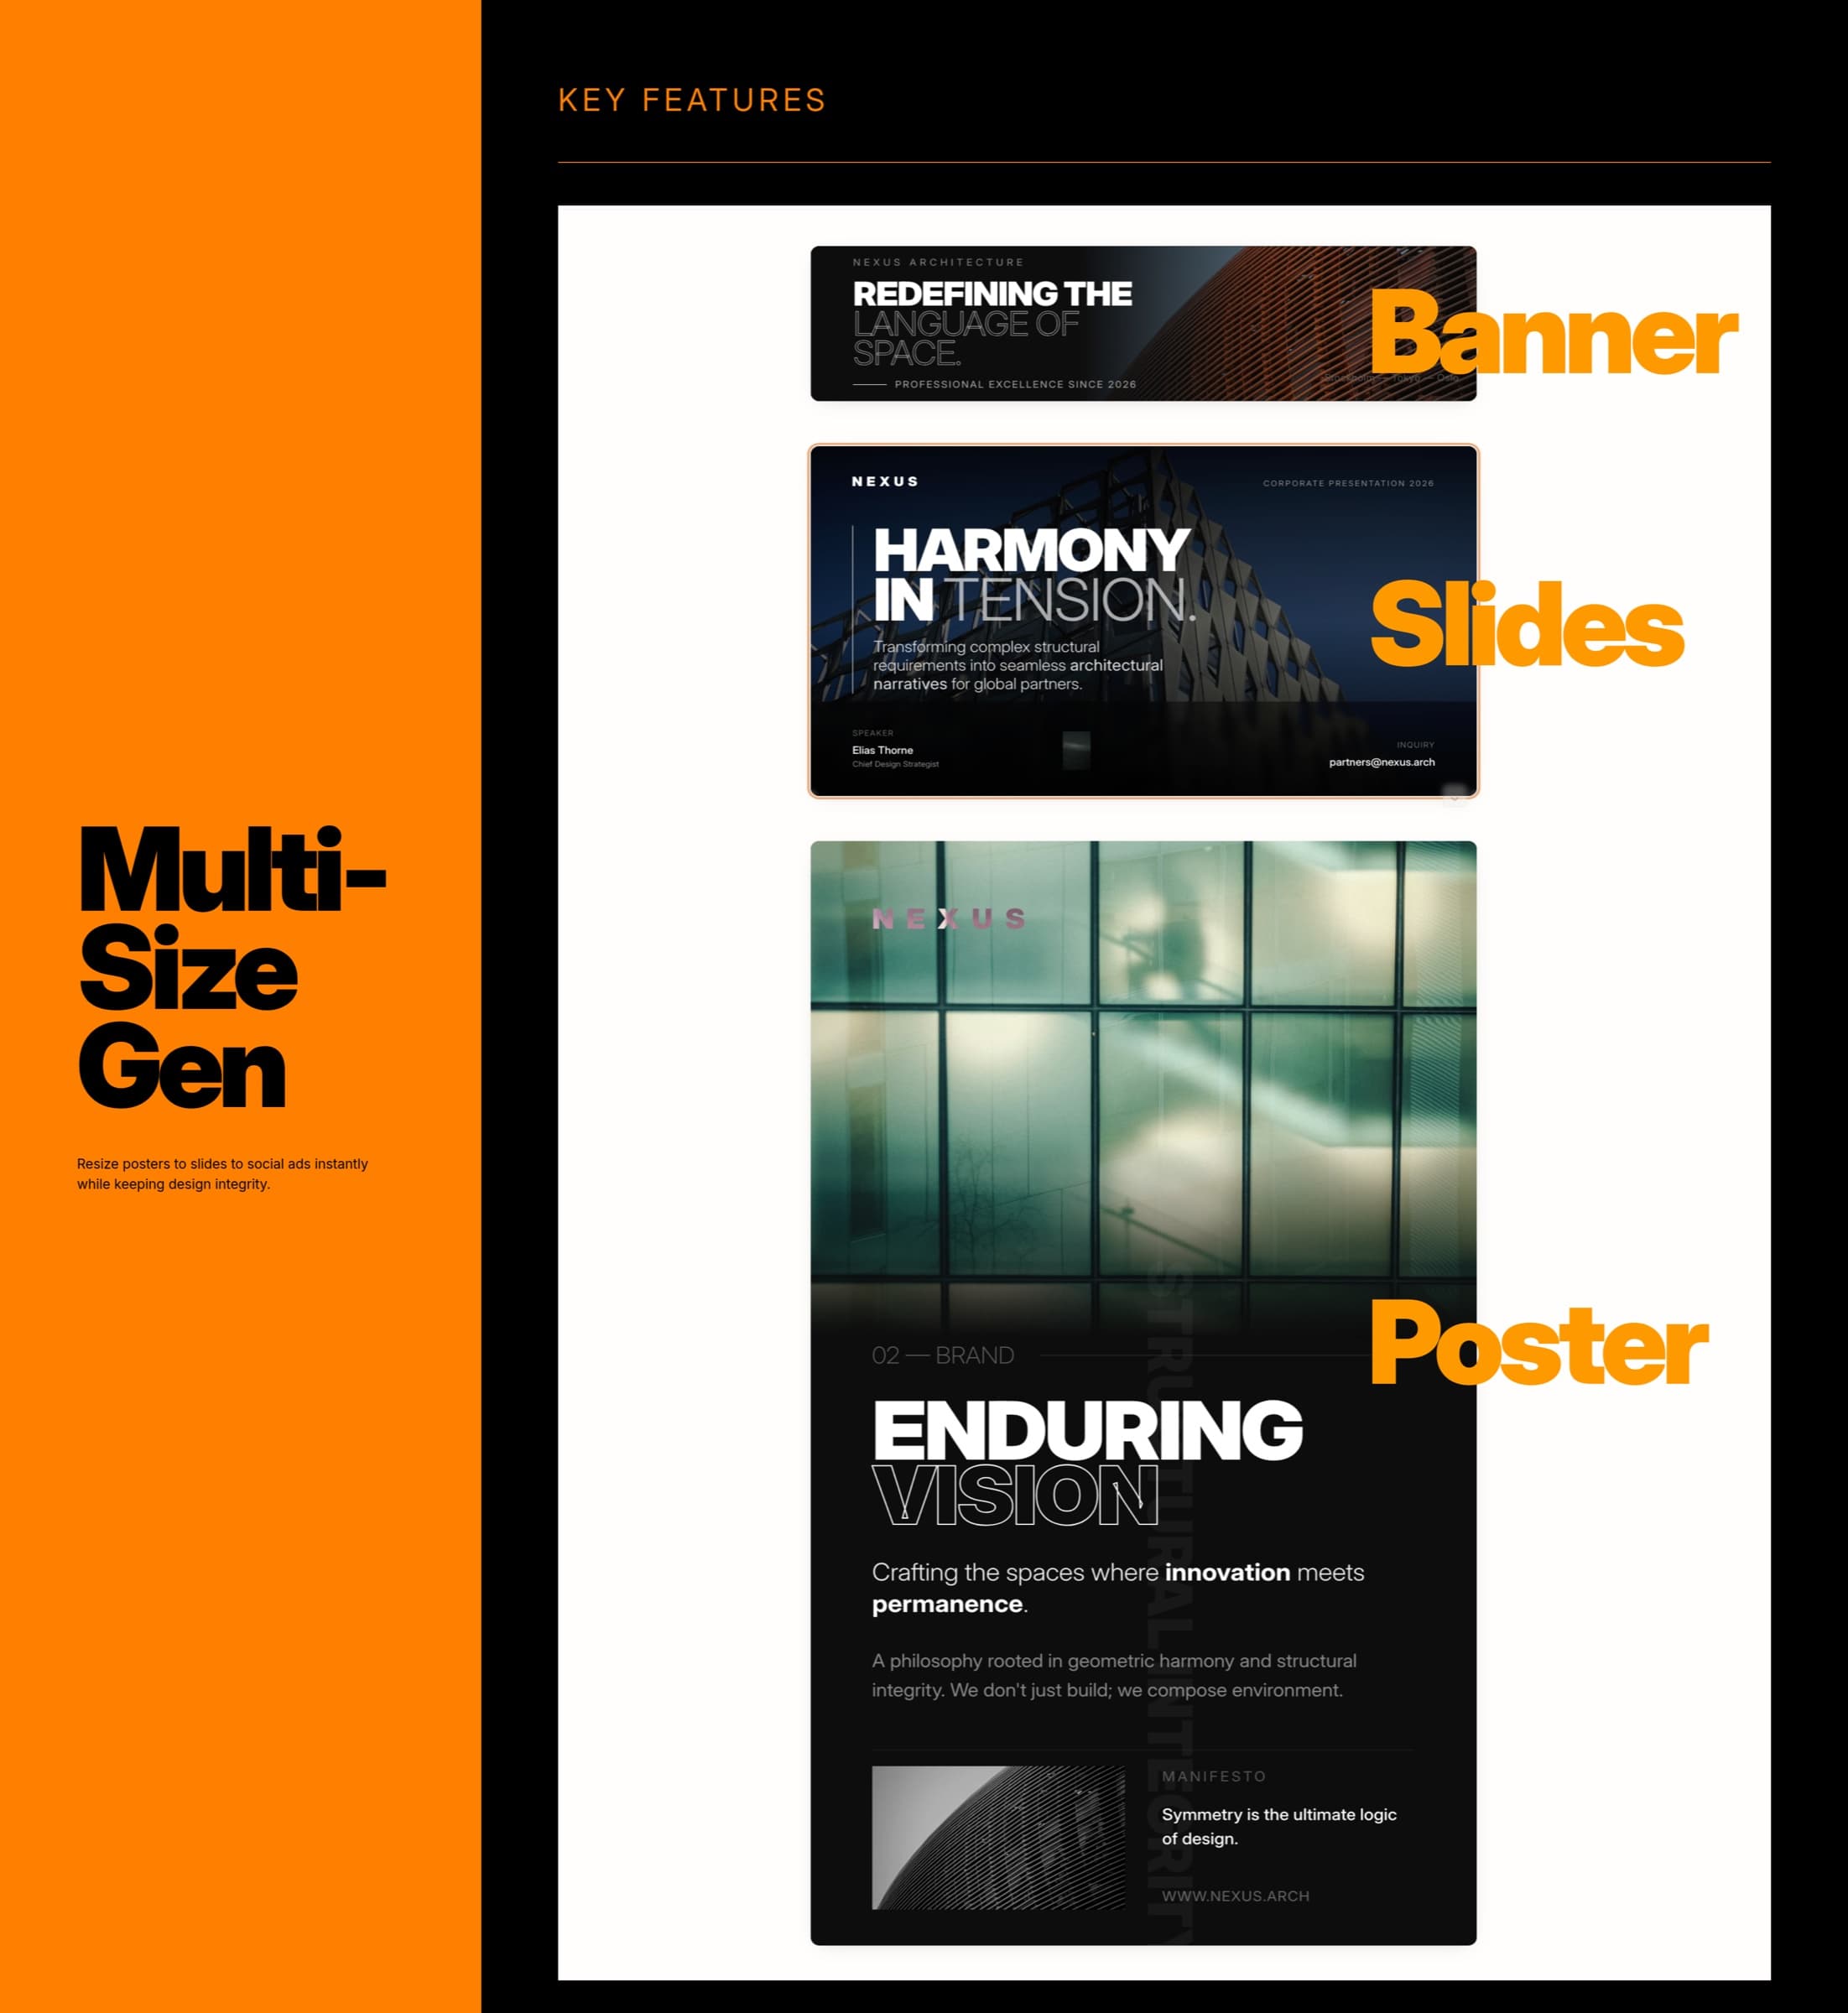
Data Visualization
Line charts, bar charts, pie charts, timelines, maps, and tables — generated from your data or AI-pulled sources.
Infographic Layouts
Visual hierarchies, icon systems, and structured information blocks that turn dense content into scannable slides.
Interactive Elements
Embed live videos, clickable diagrams, animated transitions, and interactive maps directly inside your slides.
Brand Consistency
Apply your colors, fonts, and logo across every slide automatically. Stay on-brand without manual tweaking.
One prompt. Every team. Every output.
From investor pitches to research reports — see how different teams use PageOn to ship designed work faster.
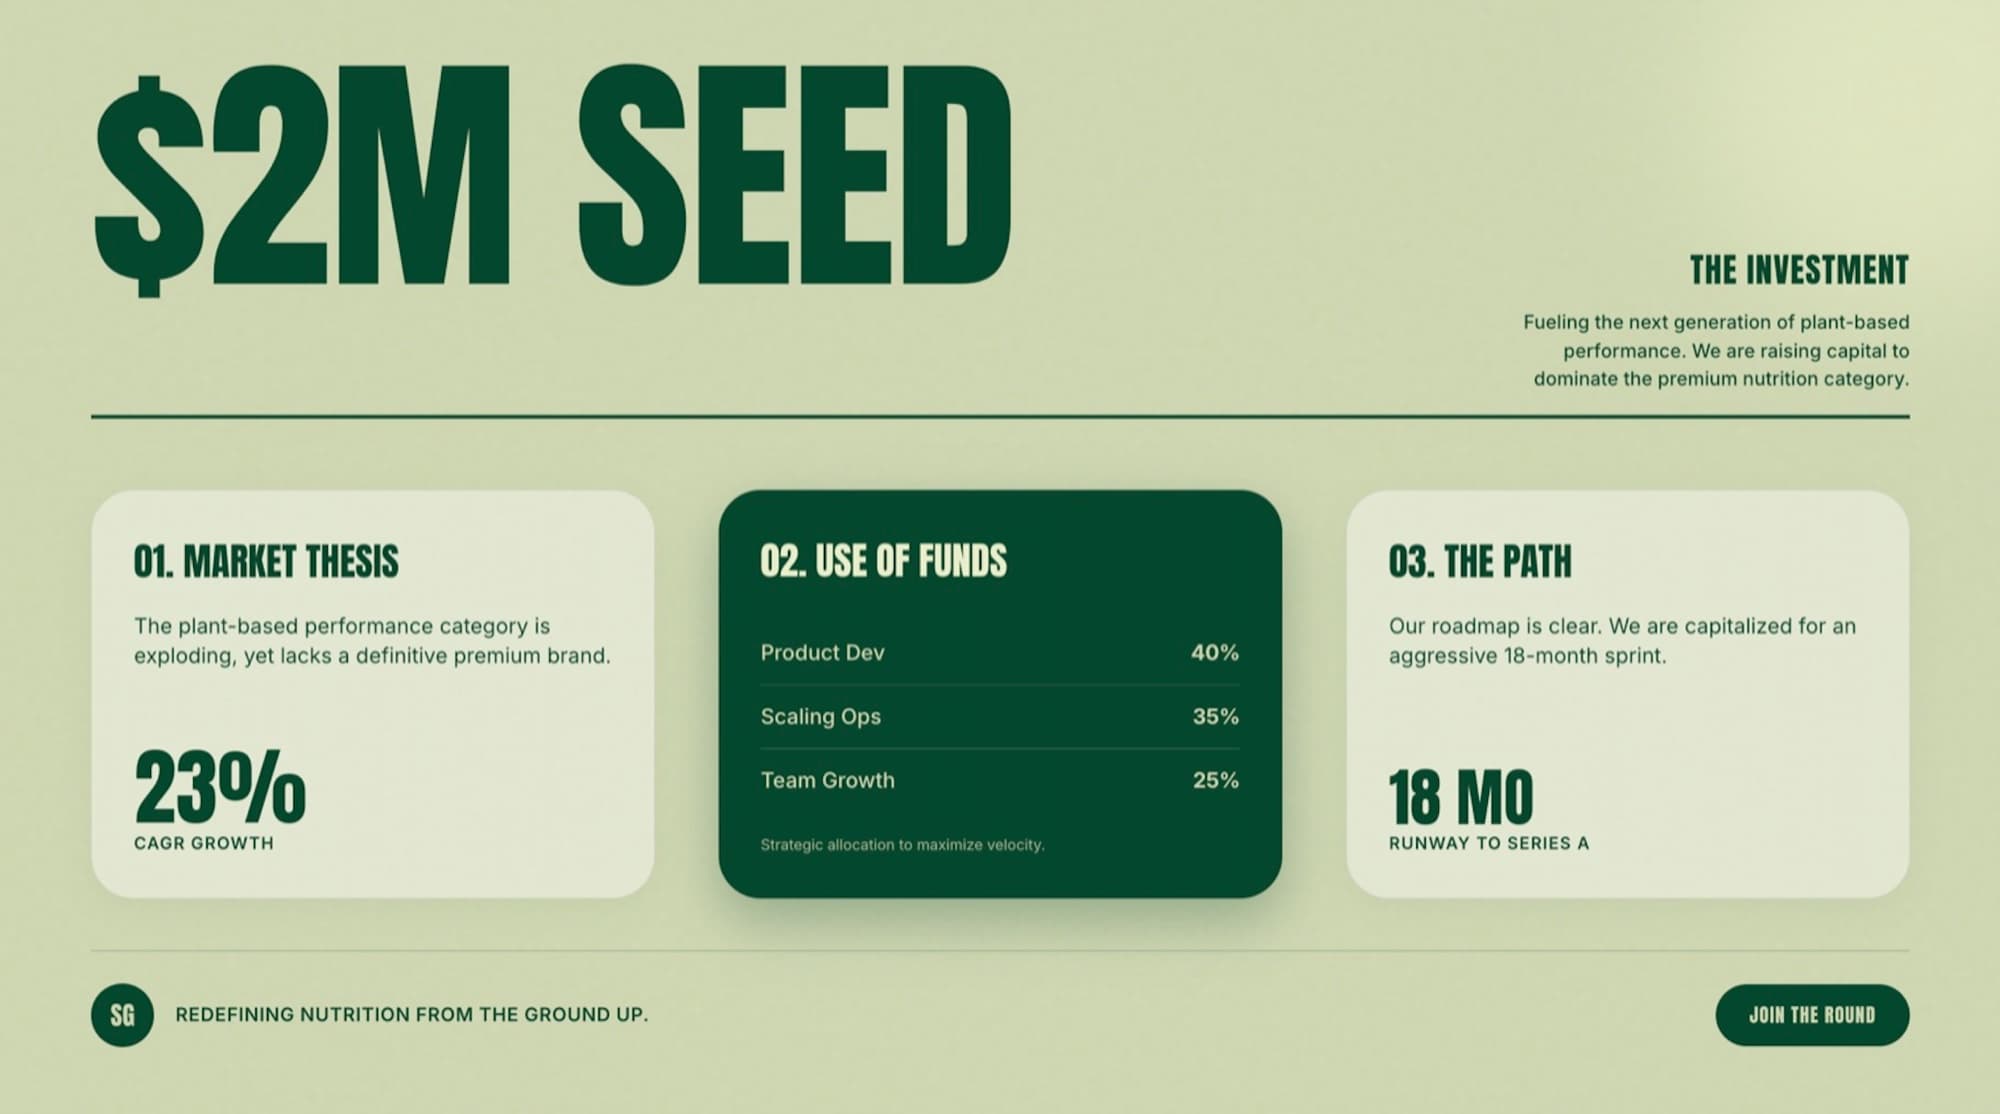
Investor pitch decks
From market size to revenue projections, every slide gets data visualization that supports your story. PageOn drafts the narrative, generates the charts, and keeps every slide on-brand — so you spend time on the pitch, not on slide formatting.
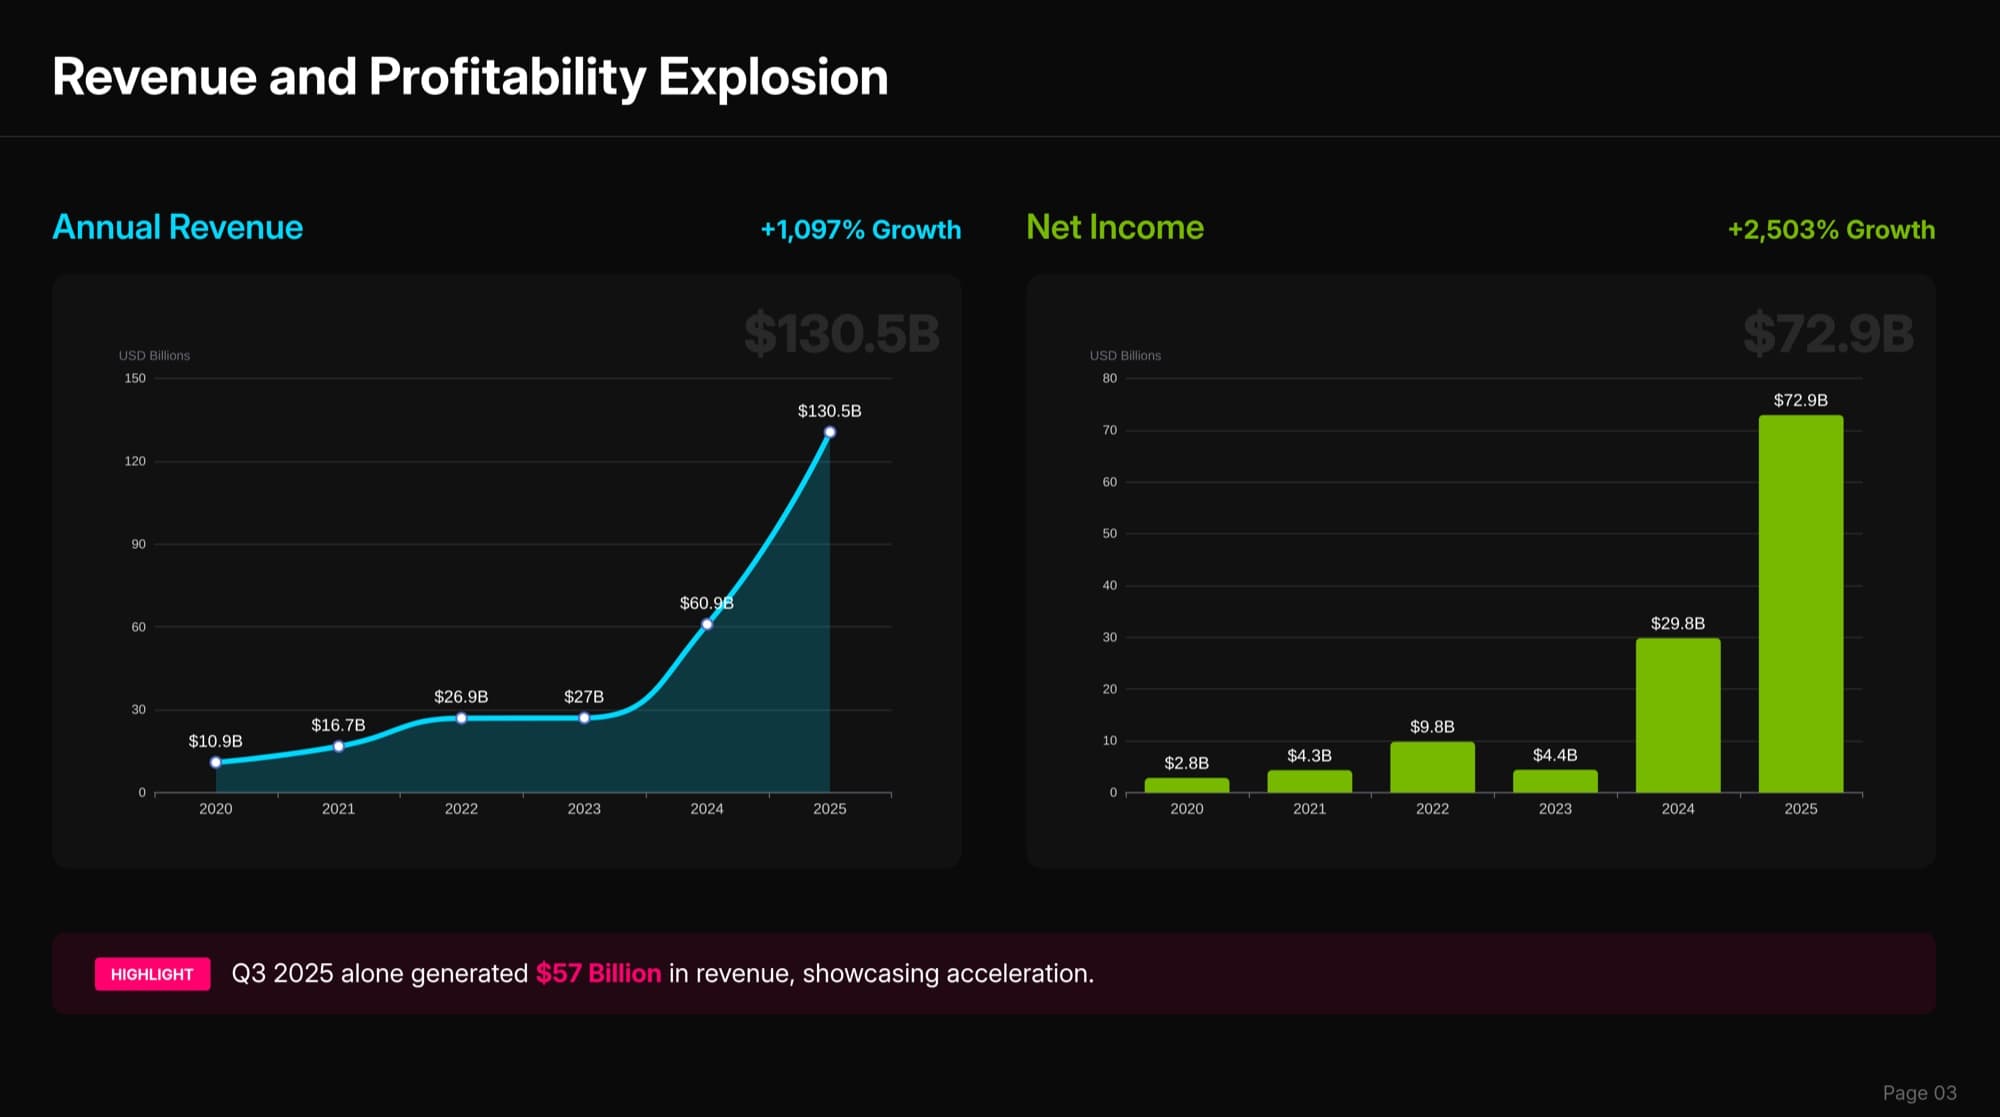
Data reports and dashboards
Import CSVs, dashboards, and analytics exports — AI generates the charts, callouts, and narrative structure. Share with stakeholders as an interactive web page, no more wrestling with chart formatting.

Educational infographics
Turn lecture notes, research papers, and training materials into infographic-style slides with visual hierarchies, diagrams, and icon systems. Learners retain more when content is designed, not dumped into bullet points.
Marketing campaign visuals
Posters, social slides, campaign decks, and event one-pagers — one prompt, any canvas. AI matches tone and typography to your audience: editorial, bold, playful, or formal, whatever the moment calls for.
A visual agent, not another template filler
Beyond bullet points
Real visual design with custom layouts, not another AI tool that just fills a template with your text.
Context-aware AI Agent
PageOn 3.0’s Agent adapts tone, layout, and narrative based on your audience — pitch, lecture, or campaign.
Point-and-chat editing
Click any element, describe the change in plain English, and let AI handle the redesign work.
Free to start
No credit card. Create your first visual presentation in minutes — all AI design features included, shareable web link on every plan.
Want a detailed comparison with Gamma, Canva, and 5 other tools? See the full 2026 comparison →
Frequently Asked Questions
Yes. The free plan includes 1 file with all AI design features and a shareable web link. Pro is $7.49/month billed annually (or $9.99/month billed monthly) for unlimited files, exports, no watermark, team sharing, and priority model access.
| Feature | Free | Pro |
|---|---|---|
| AI-generated slides, posters, infographics | ✓ | ✓ |
| Data visualization (charts, tables, timelines) | ✓ | ✓ |
| Shareable interactive web link | ✓ | ✓ |
| File creation | 1 | Unlimited |
| PageOn watermark | Included | Removed |
| Export to PDF / PowerPoint / images | — | ✓ |
| Team sharing | — | ✓ |
| Priority model access | — | ✓ |
Create your first visual presentation in minutes
Free to start. No credit card required. Designed slides, ready in minutes.
Start Creating Free