Turn Raw Data into
Visual Report Presentations
With AI
Upload a CSV, paste data, or describe the report you need. AI builds a visual presentation with charts, KPI dashboards, and infographic layouts — not a text-heavy PDF.
Free to start · No credit card · Export to PPTX on Pro
Other tools generate text documents. PageOn designs visual reports.
- ✗Generate text-heavy PDF documents with walls of paragraphs
- ✗No data visualization — numbers stay as inline text
- ✗Static layouts with no visual hierarchy
- ✗Hours of manual formatting to make reports presentable
- ✓AI designs visual presentation reports with charts and infographics
- ✓Every data point becomes a chart, KPI card, or visual callout
- ✓Custom layouts per slide — dashboards, grids, comparison panels
- ✓Upload data once, get a polished visual report in minutes
PageOn in one sentence: Upload your data or describe your report and get a designer-quality visual presentation — with charts, KPI dashboards, and infographic layouts — not a text document you still need to format.
From raw data to visual reports in four steps
- 01
Upload your data or describe your report
Drag in a CSV, paste a data table, upload a document, or simply describe the report you need. PageOn also accepts URLs, PDFs, Word files, and images.
- 02
AI analyzes and structures your information
The AI agent reads your data, identifies key metrics, trends, and comparisons, then plans a slide-by-slide report structure tailored to your audience and purpose.
- 03
Every slide gets custom data visualizations
Revenue becomes bar charts. KPIs become dashboard cards. Comparisons become side-by-side grids. Each slide is designed individually with the right visualization for its data type.
- 04
Refine with chat, then share or export
Click any element and ask the AI to adjust it. Change chart types, add slides, or update data points. Share via an interactive web link on any plan, or export to PowerPoint, PDF, and images with Pro.
Have a specific file format? PageOn also converts PDFs, Word docs, plain text and outlines, CSV spreadsheets, and images into presentations.
Your data, visualized as a presentation

Data Intelligence
PageOn reads CSVs, documents, URLs, and pasted data. It identifies metrics, trends, categories, and relationships — then decides how each data point should be visualized in your report.
Automatic Chart Generation
Numbers don’t stay as text. The AI generates bar charts, line graphs, pie charts, radar diagrams, and more — choosing the right chart type based on your data context.
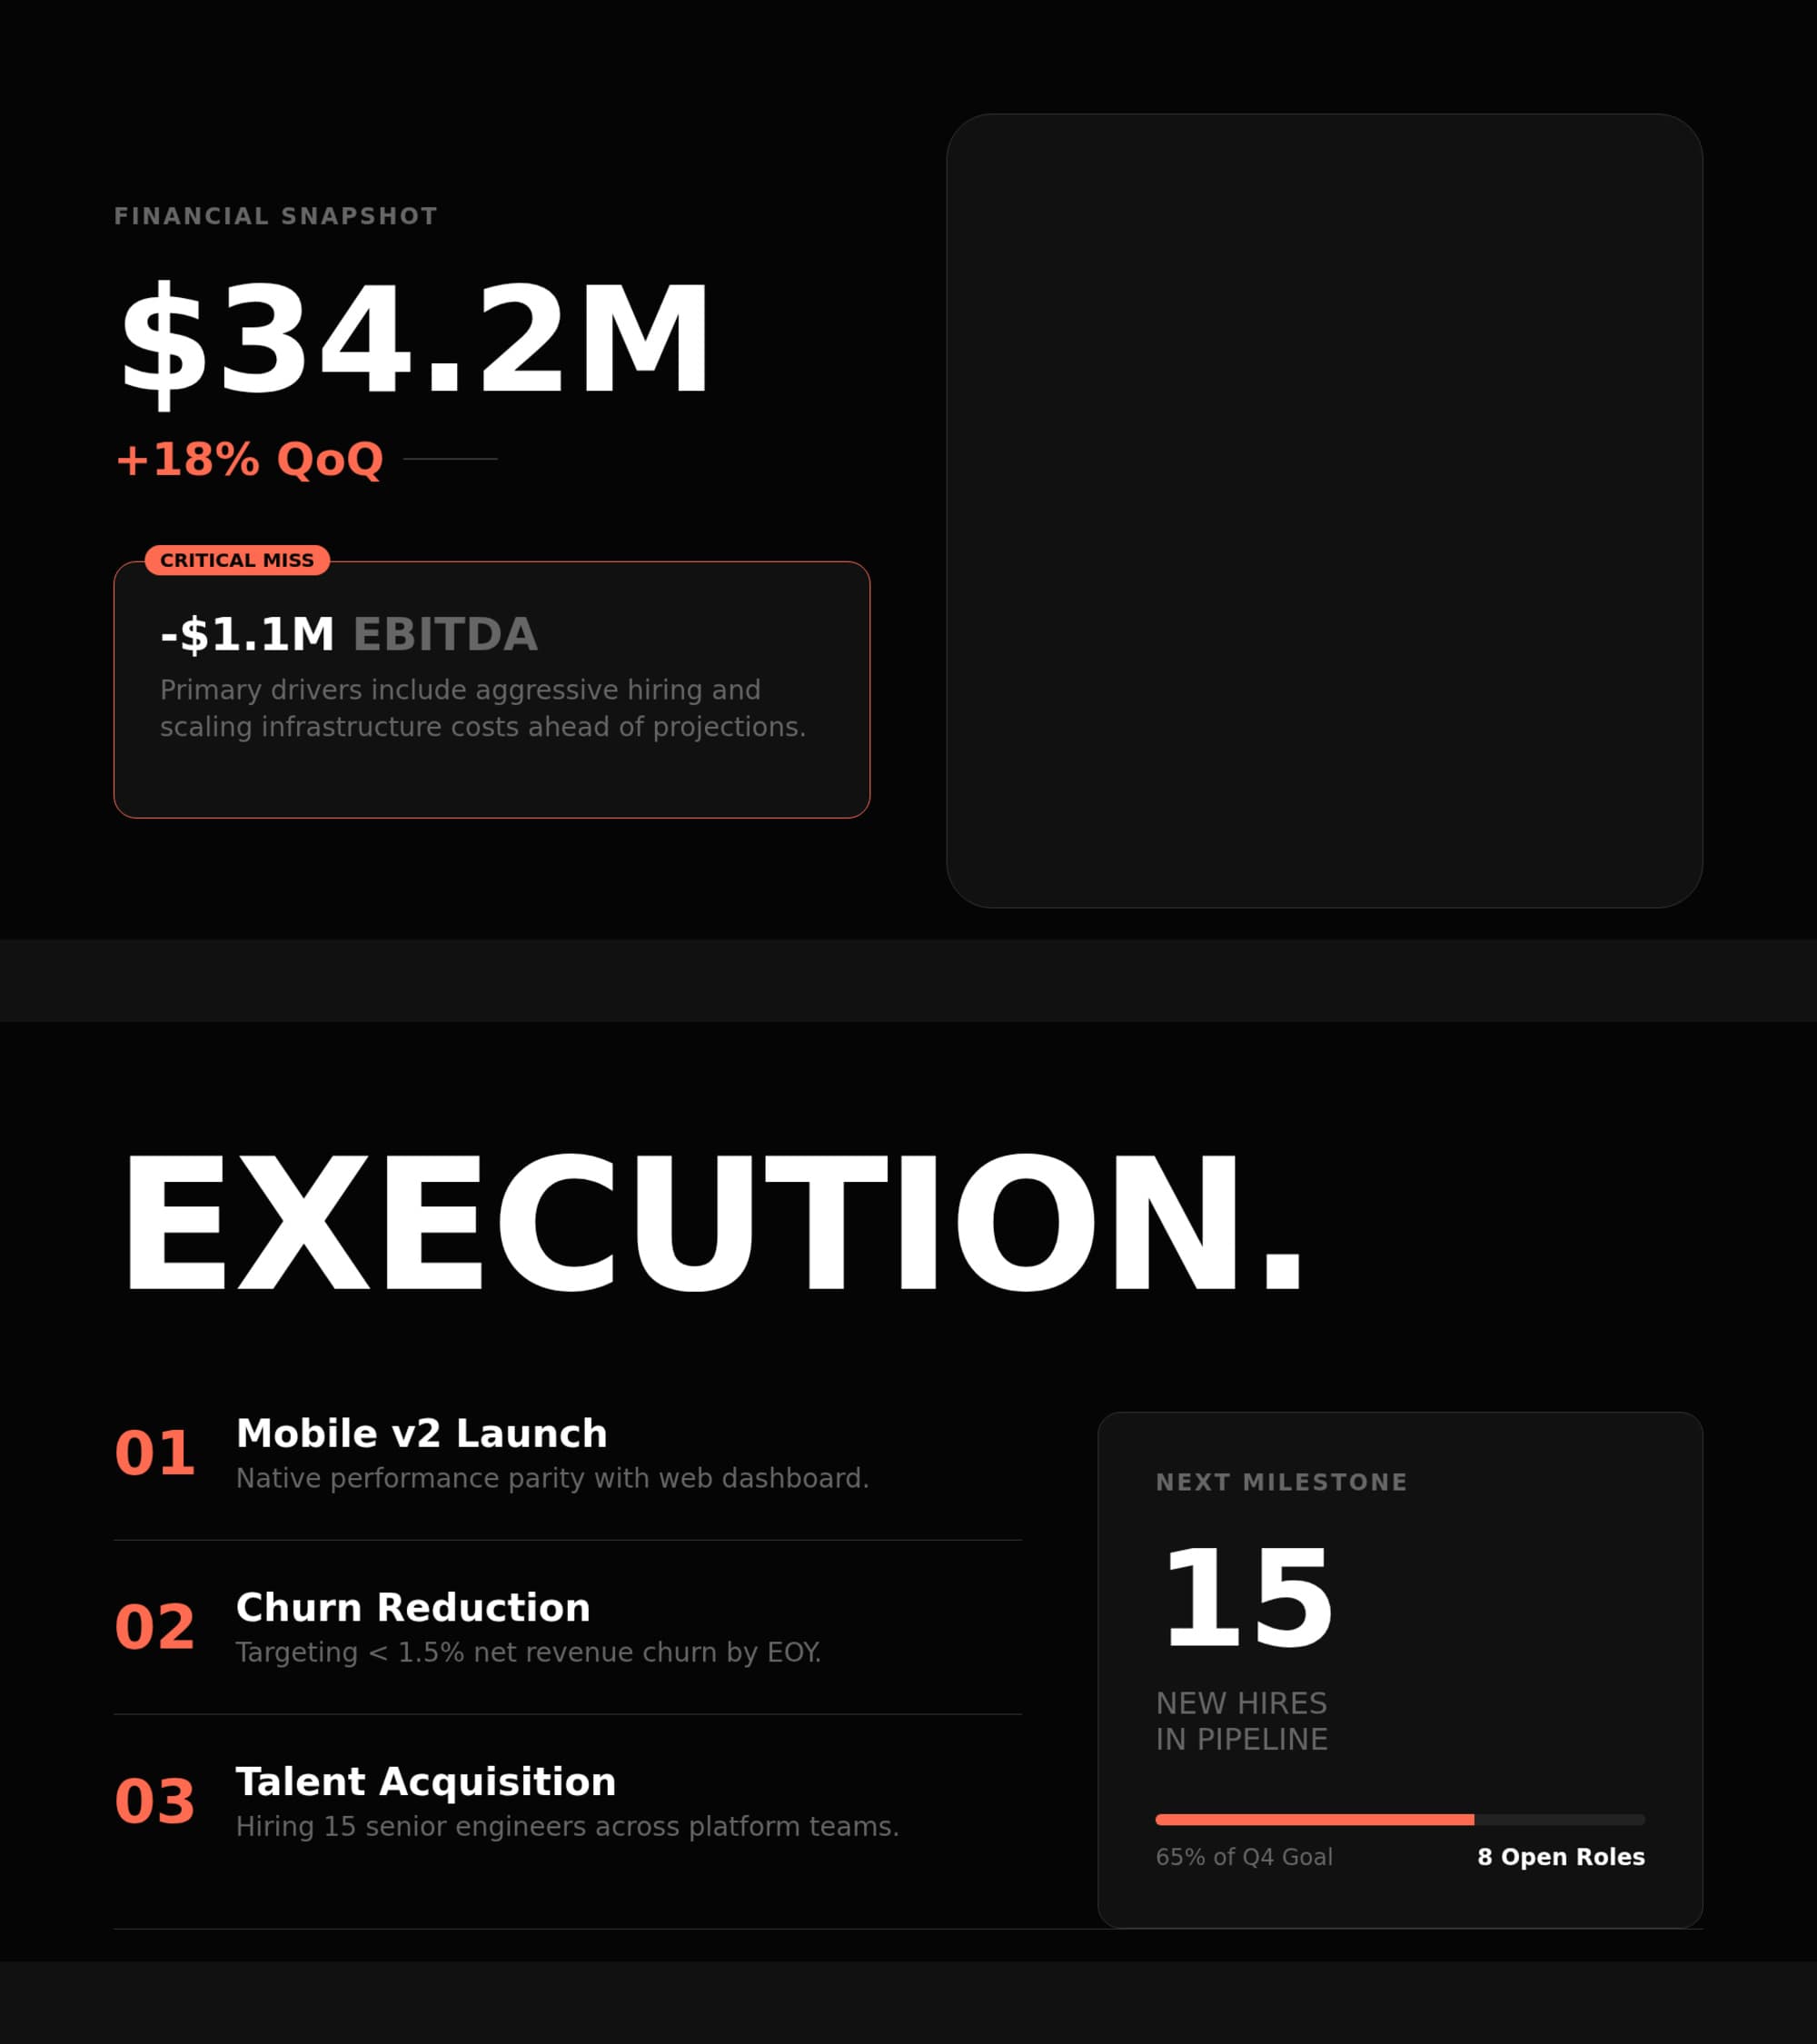
KPI Dashboard Layouts
Key metrics become dashboard-style slides with large callout numbers, progress bars, trend indicators, and comparison cards — the executive summary your stakeholders expect.
Brand-Consistent Design
Apply your brand colors, fonts, and logo across every slide automatically. Whether your data is raw or polished, the output maintains a cohesive visual identity throughout.
Any data. Any stakeholder. Report-ready.
From financial data to research findings — see how teams use PageOn to turn raw information into visual reports that drive decisions.

Financial reports to investor updates
Upload your financial data or quarterly results. PageOn builds an investor-ready presentation with revenue charts, margin analysis, cash flow visuals, and KPI dashboard slides — from spreadsheet to boardroom in minutes.

Market research to strategy presentations
Feed in market data, competitive intelligence, or industry reports. AI structures a visual strategy deck with TAM/SAM/SOM breakdowns, competitive landscapes, and trend analysis charts — ready for the leadership team.

Performance metrics to stakeholder updates
Upload your performance data or paste key metrics. PageOn creates a stakeholder update with before/after comparisons, KPI dashboards, trend lines, and progress indicators — no more copy-pasting numbers into slides.

Research data to visual analysis
Upload your research dataset or describe your findings. AI visualizes methodology, results, and statistical significance with appropriate chart types — from raw data to conference-ready slides.

OKR/KPI tracking to exec summaries
Feed in your OKR progress data or KPI spreadsheet. PageOn generates an executive summary with goal completion gauges, milestone timelines, risk indicators, and team performance dashboards.

Compliance data to board presentations
Upload audit findings, compliance metrics, or risk assessments. AI structures a board-ready presentation with phased roadmaps, compliance scorecards, and risk heat maps — turning dense regulatory data into clear visual narratives.
Frequently Asked Questions
Yes. The free plan includes 1 file with all AI design features and a shareable web link. Pro is $7.49/month billed annually (or $9.99/month billed monthly) for unlimited files, exports, no watermark, team sharing, and priority model access.
| Feature | Free | Pro |
|---|---|---|
| AI-designed report slides | ✓ | ✓ |
| Data visualization (charts, dashboards) | ✓ | ✓ |
| Shareable interactive web link | ✓ | ✓ |
| File creation | 1 | Unlimited |
| PageOn watermark | Included | Removed |
| Export to PDF / PowerPoint / images | — | ✓ |
| Team sharing | — | ✓ |
| Priority model access | — | ✓ |
Need video instead? iart.ai turns any webpage or document into broadcast-quality motion graphics — also made by our team.
Turn your first dataset into a visual report in minutes
Free to start. No credit card required. Charts and dashboards, not paragraphs.
Try PageOn Free